Careful!
You are browsing documentation for the next version of Kuma. Use this version at your own risk.
Collect metrics with OpenTelemetry
Kuma provides integration with OpenTelemetry. You can collect and push data plane proxy and application metrics to OpenTelemetry collector. Which opens up lots of possibilities of processing and exporting metrics to multiple ecosystems like Dash0, Datadog, Grafana cloud, Honeycomb and more.
Prerequisites
- Completed quickstart to set up a zone control plane with demo application
- Enable auto increment in demo-app GUI http://127.0.0.1:5000
If you are already familiar with quickstart you can set up required environment by running:
helm upgrade \
  --install \
  --create-namespace \
  --namespace kuma-system \
  kuma kuma/kuma
kubectl wait -n kuma-system --for=condition=ready pod --selector=app=kuma-control-plane --timeout=90s
kubectl apply -f https://raw.githubusercontent.com/kumahq/kuma-counter-demo/refs/heads/main/k8s/001-with-mtls.yaml
Install Kuma observability stack
To start we need to install Kuma observability stack which is build on top of Prometheus and Grafana.
kumactl install observability | kubectl apply -f-
We will use it to scrape metrics from OpenTelemetry collector and visualise them on Kuma dashboards.
Since quickstart guide have really restrictive MeshTrafficPermissions we need to allow traffic in mesh-observability namespace:
echo "apiVersion: kuma.io/v1alpha1
kind: MeshTrafficPermission
metadata:
  namespace: mesh-observability
  name: allow-observability
spec:
  from:
    - targetRef:
        kind: Mesh
      default:
        action: Allow" | kubectl apply -f -
Install OpenTelemetry collector
First we need an OpenTelemetry collector configuration. Save it by running:
echo "
mode: deployment
config:
  exporters:
    prometheus:
      endpoint: \${env:MY_POD_IP}:8889
  extensions:
    health_check:
      endpoint: \${env:MY_POD_IP}:13133
  processors:
    batch: {}
  receivers:
    otlp:
      protocols:
        grpc:
          endpoint: \${env:MY_POD_IP}:4317
  service:
    extensions:
      - health_check
    pipelines:
      metrics:
        receivers: [otlp]
        exporters: [prometheus]
        processors: [batch]
ports:
  otlp:
    enabled: true
    containerPort: 4317
    servicePort: 4317
    hostPort: 4317
    protocol: TCP
    appProtocol: grpc
  prometheus:
    enabled: true
    containerPort: 8889
    servicePort: 8889
    protocol: TCP
image:
  repository: 'otel/opentelemetry-collector-contrib'
resources:
  limits:
    cpu: 250m
    memory: 512Mi
" > values-otel.yaml
This is the Helm chart configuration we will be using. This will configure OpenTelemetry collector to listen on grpc port 4317 for metrics
pushed by data plane proxy, process and expose collected metrics in Prometheus format on port 8889. In the next step we
will configure Prometheus to scrape these metrics. Our configuration relies on the contrib distribution of opentelemetry-collector so we set this in the values.
Most important in this configuration is pipelines section:
pipelines:
  metrics:
    receivers: [otlp]
    exporters: [prometheus]
In this basic guide we will focus only on collecting metrics, but this can be also easily configured to collect traces and logs.
We use otlp receiver to accept metrics pushed from data plane proxies.
Then we have basic recommended processors to limit memory usage and to process metrics in batch. You can filter, modify and do more with available processors.
Last part is exporters section. You can export metrics to multiple destination like Prometheus, Datadog, Grafana Cloud and more. Full list of available exporters can be found here.
We will use Prometheus exporter for now.
With configuration in place we can install OpenTelemetry collector:
helm repo add open-telemetry https://open-telemetry.github.io/opentelemetry-helm-charts
helm install --namespace mesh-observability opentelemetry-collector open-telemetry/opentelemetry-collector -f values-otel.yaml
Configure Prometheus to scrape metrics from OpenTelemetry collector
We need to update prometheus-server ConfigMap and add scrape_configs entry:
- job_name: "opentelemetry-collector"
  scrape_interval: 15s
  static_configs:
    - targets: ["opentelemetry-collector.mesh-observability.svc:8889"]
Prometheus will automatically pick up this config and start scraping OpenTelemetry collector. To check if config was applied properly you can go to Prometheus GUI:
kubectl port-forward svc/prometheus-server -n mesh-observability 9090:80
Now go to http://127.0.0.1:9090/targets. You should see new target opentelemetry-collector
(This might take a minute or two to propagate):

Enable OpenTelemetry metrics and check results
By now we have installed and configured all needed observability tools: OpenTelemetry collector, Prometheus and Grafana. We can now apply MeshMetric policy:
echo 'apiVersion: kuma.io/v1alpha1
kind: MeshMetric
metadata:
  name: otel-metrics
  namespace: kuma-system
  labels:
    kuma.io/mesh: default
spec:
  default:
    backends:
      - type: OpenTelemetry
          endpoint: opentelemetry-collector.mesh-observability.svc:4317' | kubectl apply -f -
This policy will configure all data plane proxies in default Mesh to collect and push metrics to OpenTelemetry collector.
To check results we need to log into Grafana. First enable port forward to Grafana GUI:
kubectl port-forward svc/grafana -n mesh-observability 3000:80
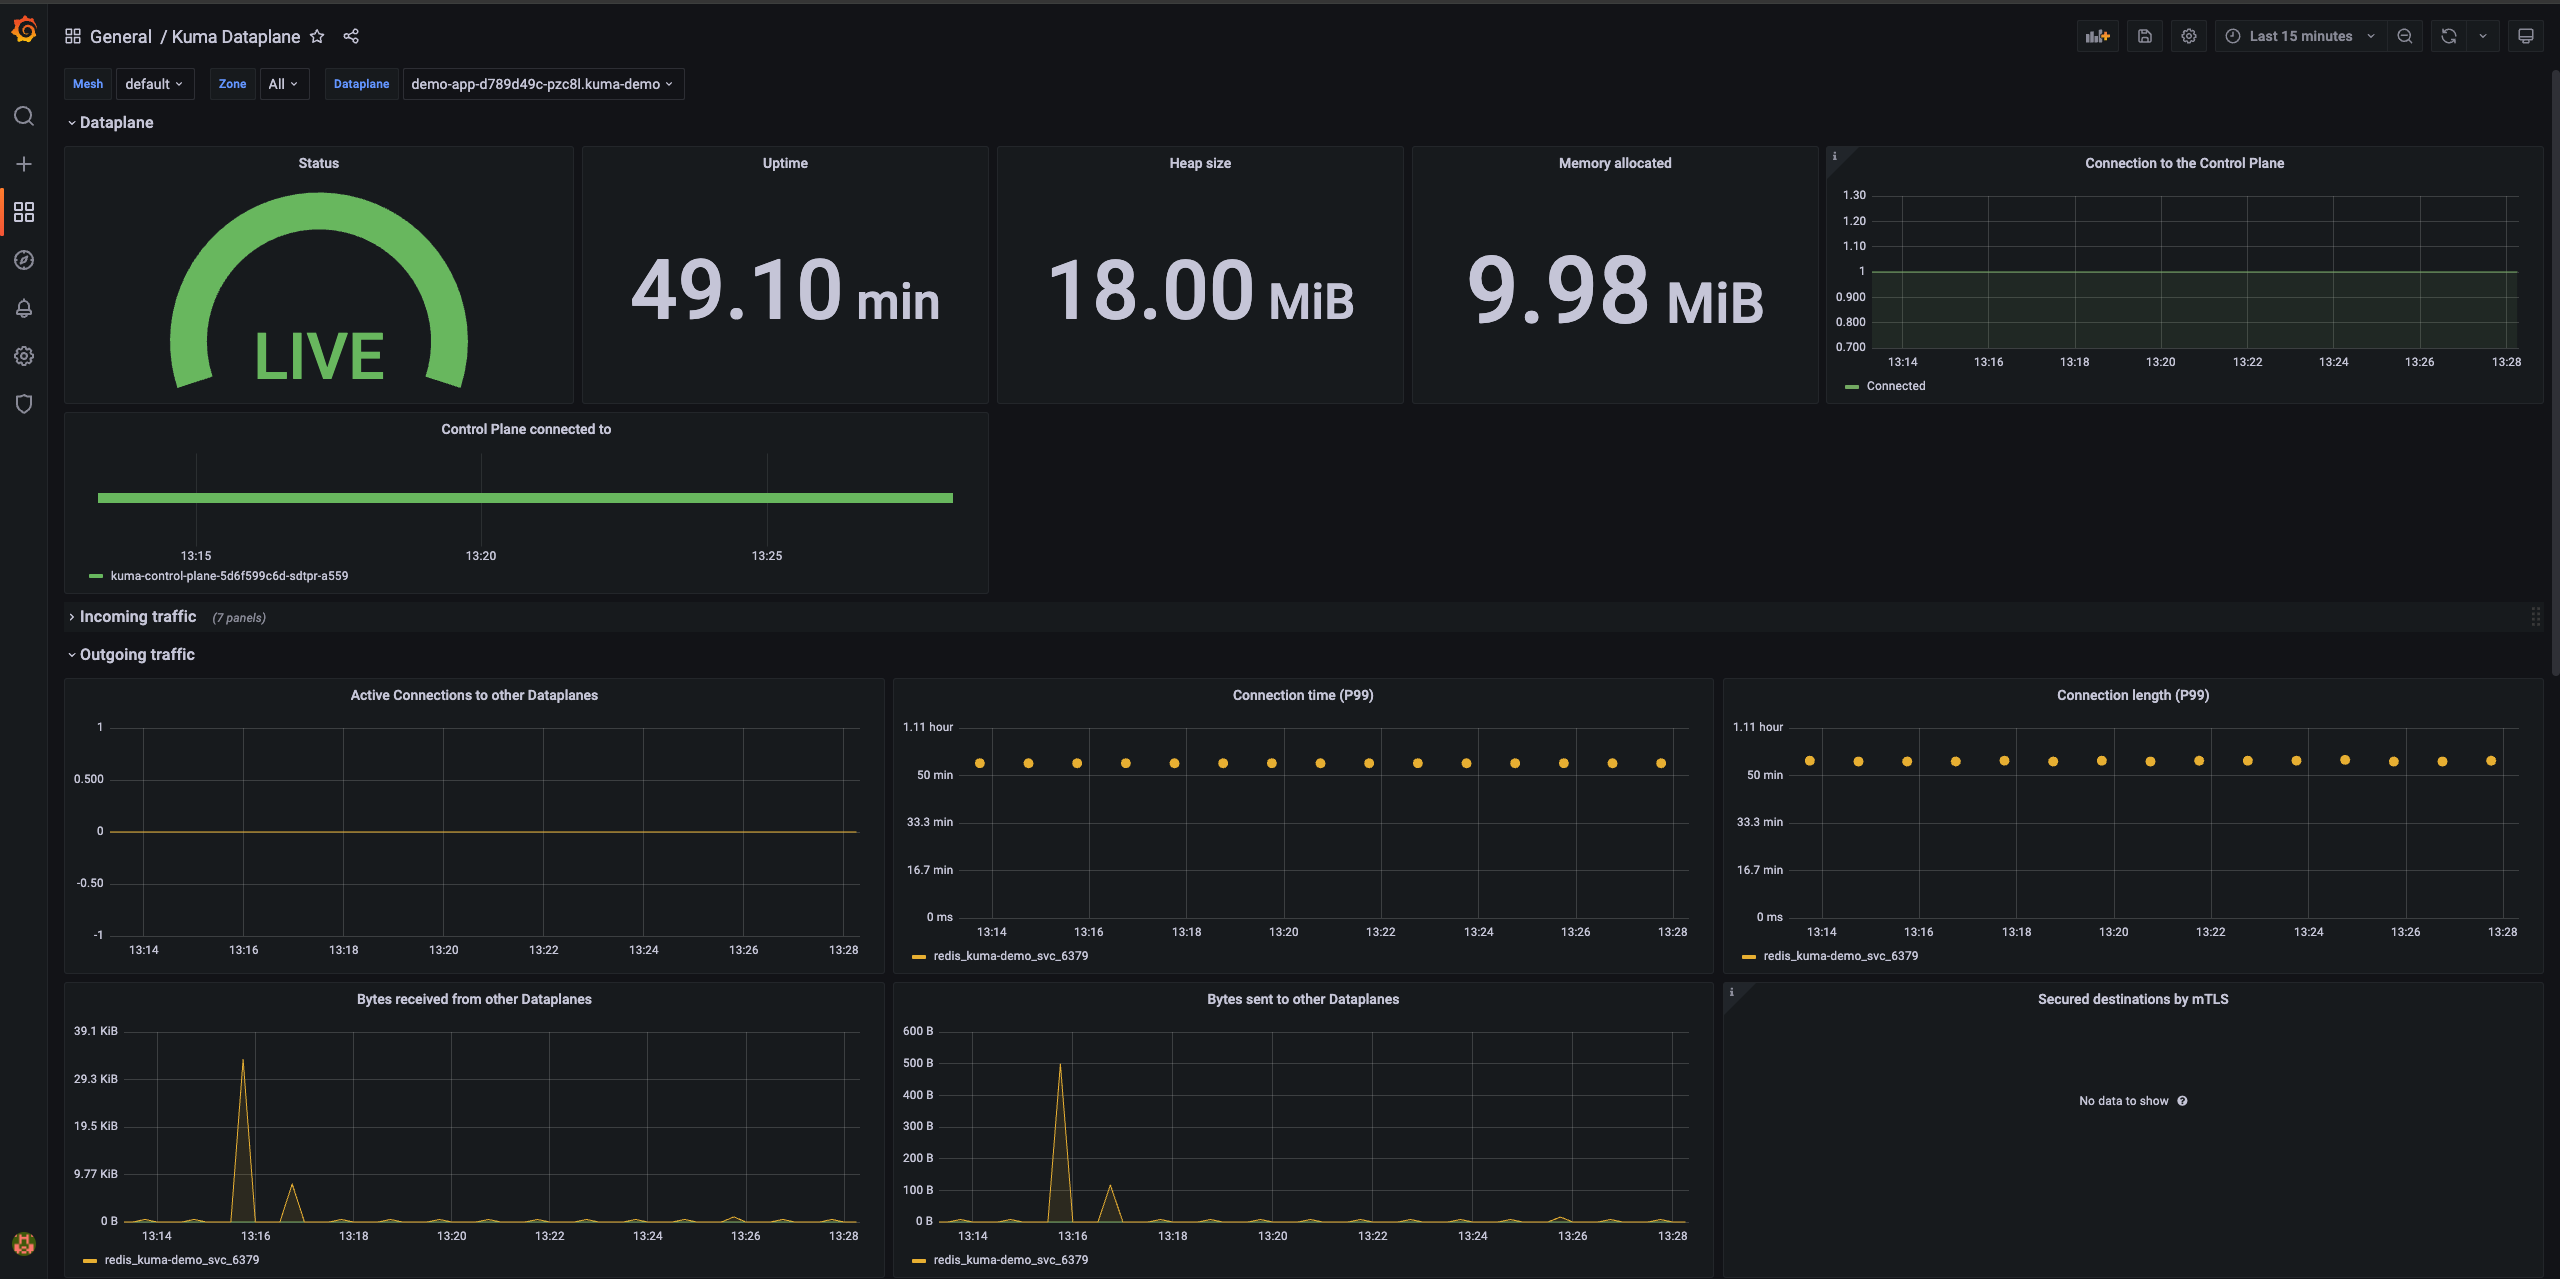
Then navigate and browse http://127.0.0.1:3000, you will be presented with the default Grafana login page, use Grafana’s default credential admin/admin to log in. By checking the Dataplane dashboard, you should see something similar to (propagation of metrics might take some time):

Next steps
- Further explore MeshMetric policy
- Explore MeshAccessLog and MeshTrace policies that work with OpenTelemetry
- Explore features of OpenTelemetry collector for metrics filtering/processing and exporting
- Checkout tutorials on how to push metrics to SaaS solutions Grafana cloud, Dash0, Datadog, Honeycomb
