Careful!
You are browsing documentation for a version of Kuma that is not the latest release.
Looking for even older versions? Learn more.
Observability
This page will describe how to configure different observability tools to work with Kuma.
Demo setup
kumactl ships with a builtin observability stack which consists of:
- prometheus for metrics
- jaeger for ingesting and storing traces
- loki for ingesting and storing logs
- grafana for querying and displaying metrics, traces and logs
First, remember to configure Kuma appropriately for the tools in the observability stack:
- Traffic metrics for telemetry
TrafficTracefor tracingTrafficLogfor logging
On Kubernetes, the stack can be installed with:
kumactl install observability | kubectl apply -f -
This will create a namespace mesh-observability with prometheus, jaeger, loki and grafana installed and setup to work with Kuma.
This setup is meant to be used for trying out Kuma. It is in no way fit for use in production. For production setups we recommend referring to each project’s website or to use a hosted solution like Grafana cloud or Datadog.
Control plane metrics
Control plane metrics are exposed on port :5680 and available under the standard path /metrics.
Configuring Prometheus
The Kuma community has contributed a builtin service discovery to Prometheus, it is documented in the Prometheus docs. This service discovery will connect to the control plane and retrieve all data planes with enabled metrics which Prometheus will scrape and retrieve metrics according to your traffic metrics setup.
There are 2 ways you can run prometheus:
- Inside the mesh (default for
kumactl install observability). In this case you can use mTLS to retrieve the metrics. This provides high security but will require one prometheus per mesh and might not be accessible if your mesh becomes unavailable. It will also require one Prometheus deployment per Kuma mesh. - Outside the mesh. In this case you’ll need to specify
skipMTLS: truein the traffic metrics configuration. This is less secured but will ensure Prometheus is as available as possible. It is also easier to add to an existing setup with services in and outside the mesh.
In production, we recommend the second option as it provides better visibility when things go wrong, and it’s usually acceptable for metrics to be less secure.
Using an already existing prometheus setup
In Prometheus version 2.29 and later, you can add Kuma metrics to your prometheus.yml:
scrape_configs:
    - job_name: 'kuma-dataplanes'
      scrape_interval: "5s"
      relabel_configs:
      - source_labels:
        - __meta_kuma_mesh
        regex: "(.*)"
        target_label: mesh
      - source_labels:
        - __meta_kuma_dataplane
        regex: "(.*)"
        target_label: dataplane
      - source_labels:
        - __meta_kuma_service
        regex: "(.*)"
        target_label: service
      - action: labelmap
        regex: __meta_kuma_label_(.+)
      kuma_sd_configs:
      - server: "http://kuma-control-plane.kuma-system.svc:5676" # replace with the url of your control plane
For more information, see the Prometheus documentation.
For earlier versions of Prometheus, Kuma provides the kuma-prometheus-sd tool, which runs alongside your Prometheus instance.
This tool fetches a list of current data plane proxies from the Kuma control plane and saves the list in Prometheus-compatible format
to a file on disk. Prometheus watches for changes to the file and updates its scraping configuration accordingly.
-
Run
kuma-prometheus-sd, for example:kuma-prometheus-sd run \ --cp-address=grpcs://kuma-control-plane.internal:5676 \ --output-file=/var/run/kuma-prometheus-sd/kuma.file_sd.json -
Configure Prometheus to read from the file you just saved. For example, add the following snippet to
prometheus.yml:scrape_configs: - job_name: "kuma-dataplanes" scrape_interval: 15s file_sd_configs: - files: - /var/run/kuma-prometheus-sd/kuma.file_sd.json
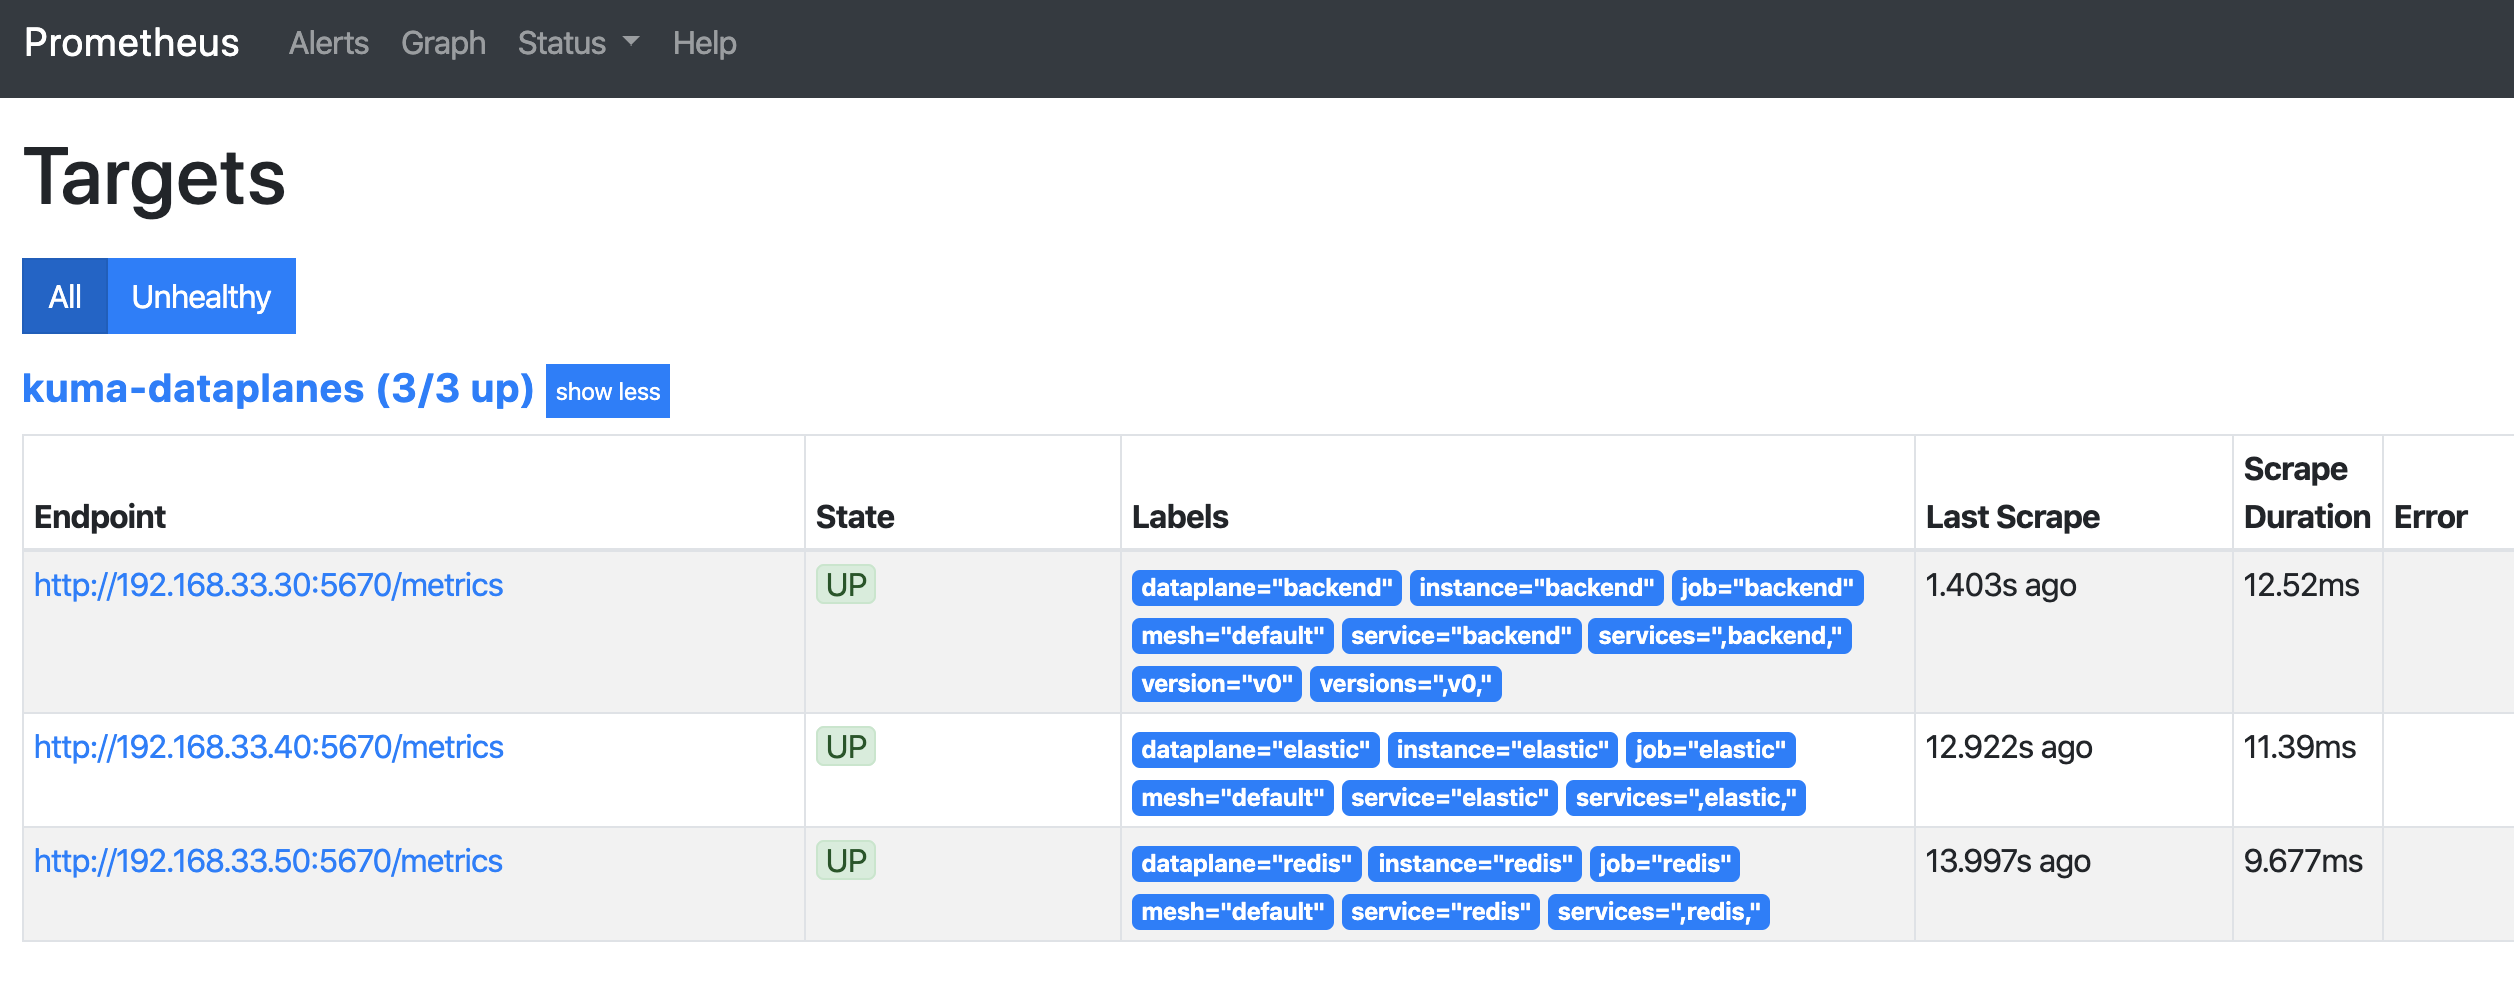
If you have traffic metrics enabled for your mesh, check the Targets page in the Prometheus dashboard. You should see a list of data plane proxies from your mesh. For example:
Configuring Grafana
Visualizing traces
To visualise your traces you need to have Grafana up and running.
kumactl install observability sets this up out of the box.
With Grafana installed you can configure a new datasource with url:http://jaeger-query.mesh-observability/ (or whatever url jaeger can be queried at).
Grafana will then be able to retrieve the traces from Jaeger.
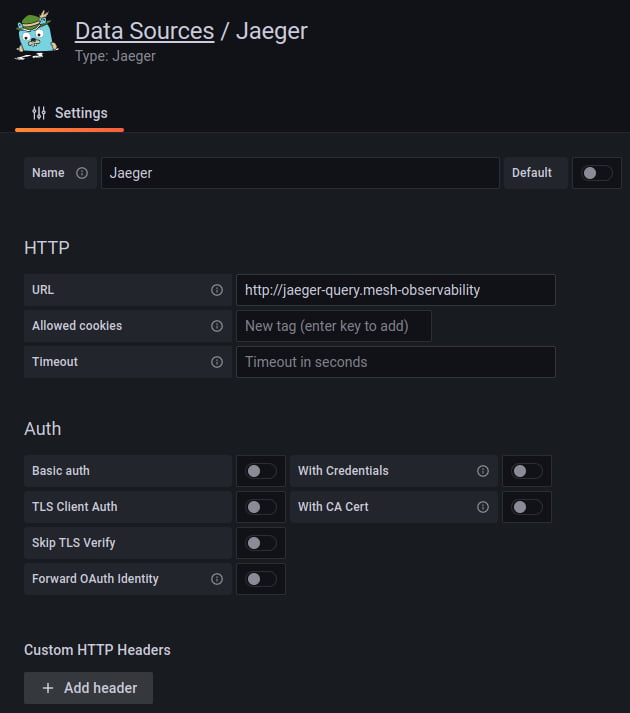
You can then add a TrafficTrace policy to your mesh to start emitting traces. At this point you can visualize your traces in Grafana by choosing the jaeger datasource in the explore section.
Visualizing logs
To visualise your containers’ logs and your access logs you need to have a Grafana up and running.
kumactl install observability sets this up out of the box.
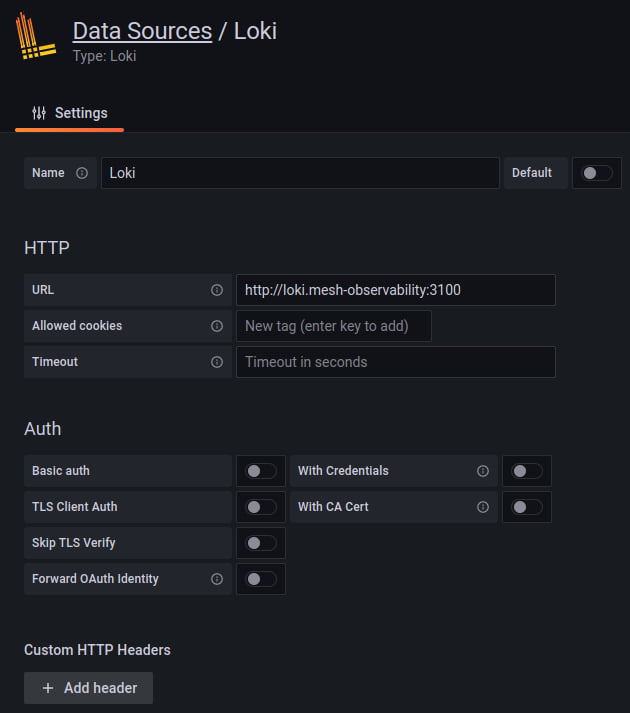
You can then add a TrafficLog policy to your mesh to start emitting access logs. Loki will pick up logs that are sent to stdout. To send logs to stdout you can configure the logging backend as shown below:
apiVersion: kuma.io/v1alpha1
kind: Mesh
metadata:
  name: default
spec:
  logging:
    defaultBackend: stdout
    backends:
      - name: stdout
        type: file
        conf:
          path: /dev/stdout
At this point you can visualize your containers’ logs and your access logs in Grafana by choosing the loki datasource in the explore section.
For example, running: {container="kuma-sidecar"} |= "GET" will show all GET requests on your cluster.
To learn more about the search syntax check the Loki docs.
Nice to have
Having your Logs and Traces in the same visualisation tool can come really handy. By adding the traceId in your app logs you can visualize your logs and the related Jaeger traces.
To learn more about it go read this article.
Grafana extensions
The Kuma community has built a datasource and a set of dashboards to provide great interactions between Kuma and Grafana.
Datasource and service map
The Grafana Datasource is a datasource specifically built to relate information from the control plane with Prometheus metrics.
Current features include:
- Display the graph of your services with the MeshGraph using Grafana nodeGraph panel.
- List meshes.
- List zones.
- List services.
To use the plugin you’ll need to add the binary to your Grafana instance by following the installation instructions.
To make things simpler the datasource is installed and configured when using kumactl install observability.
Dashboards
Kuma ships with default dashboards that are available to import from the Grafana Labs repository.
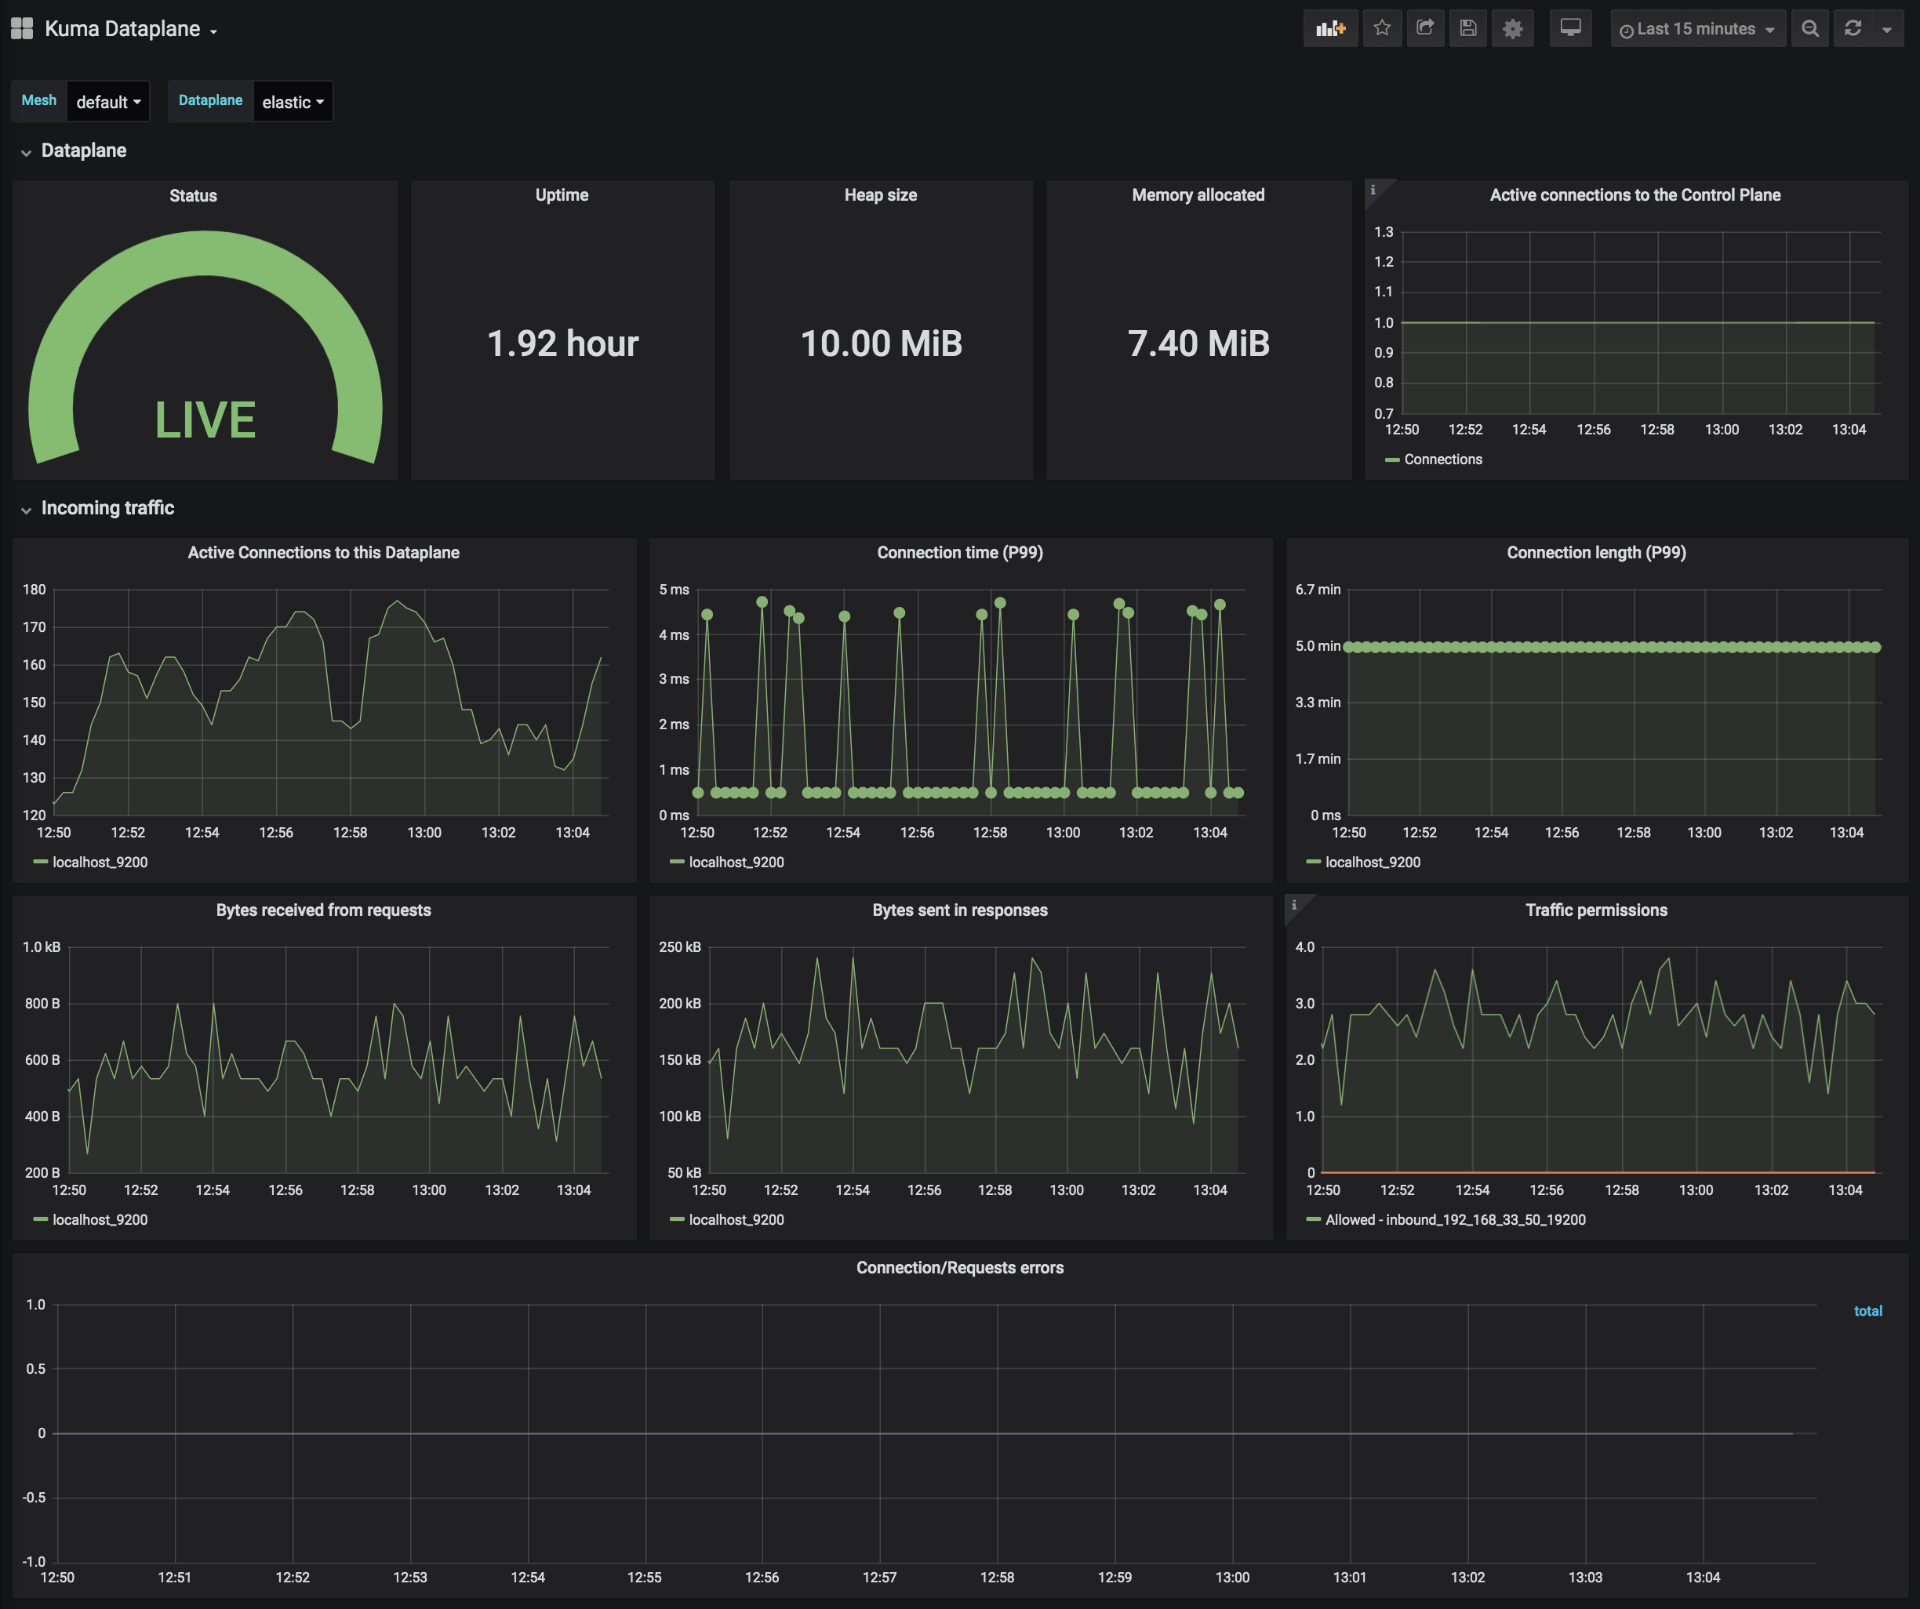
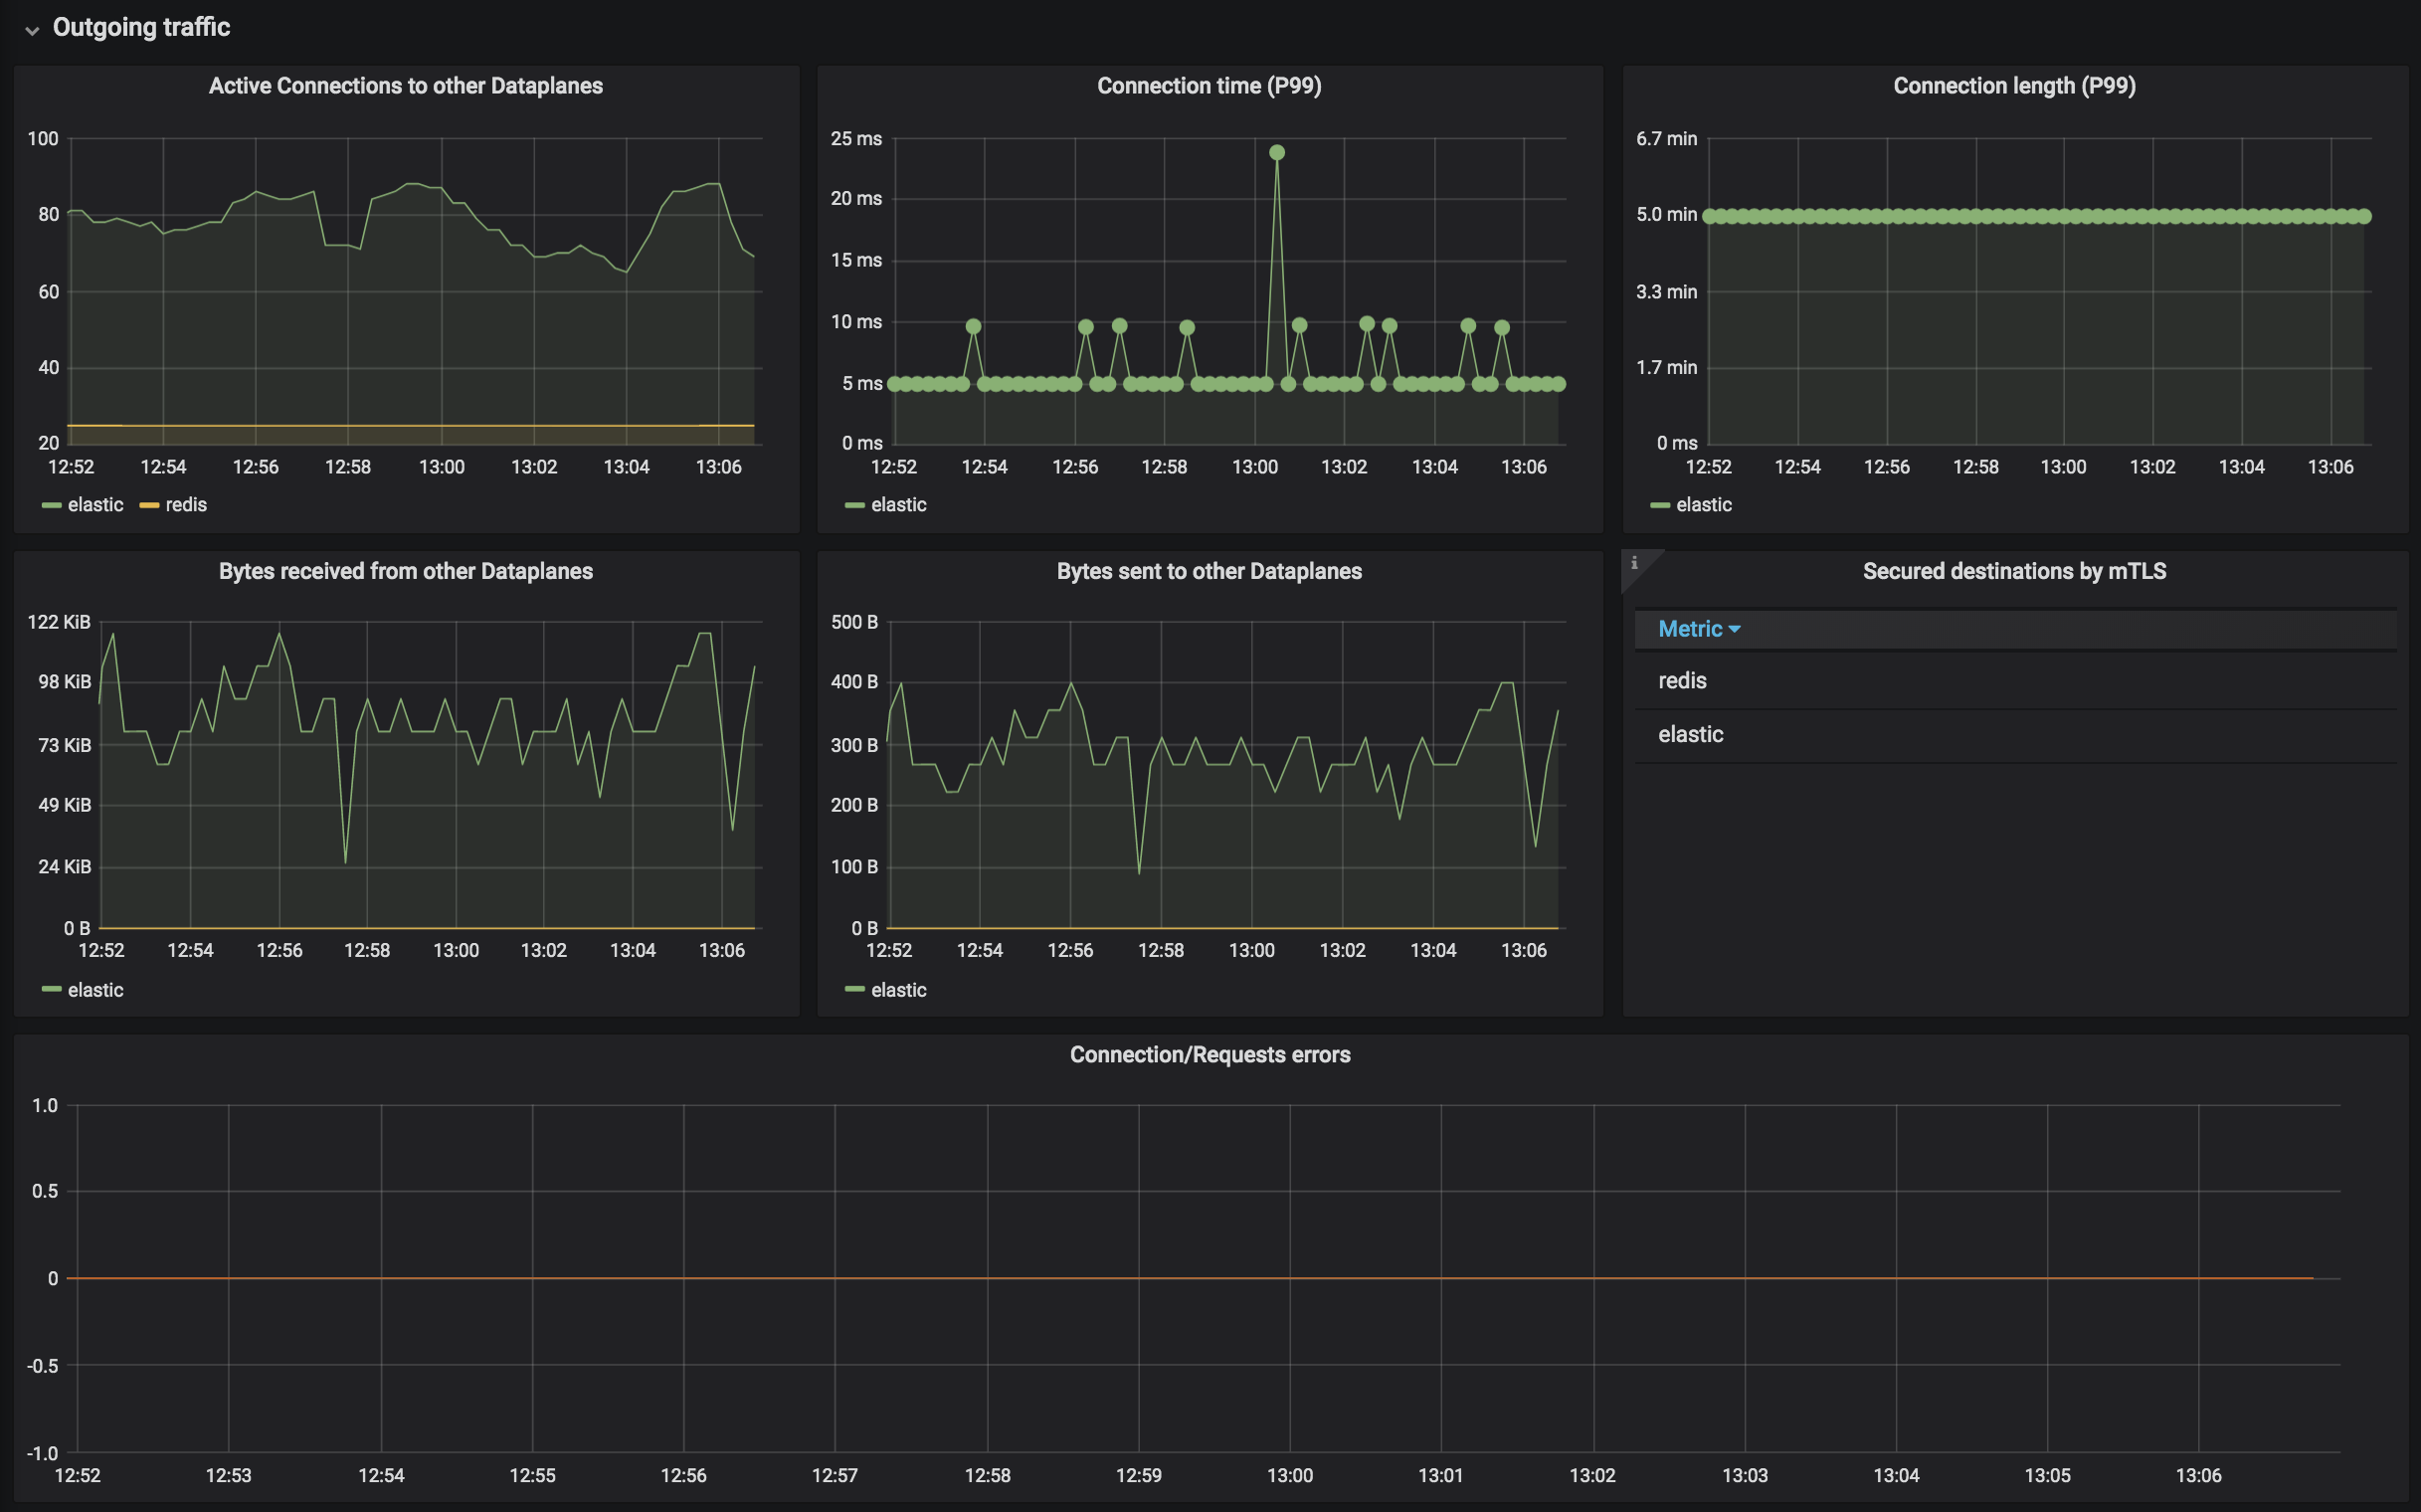
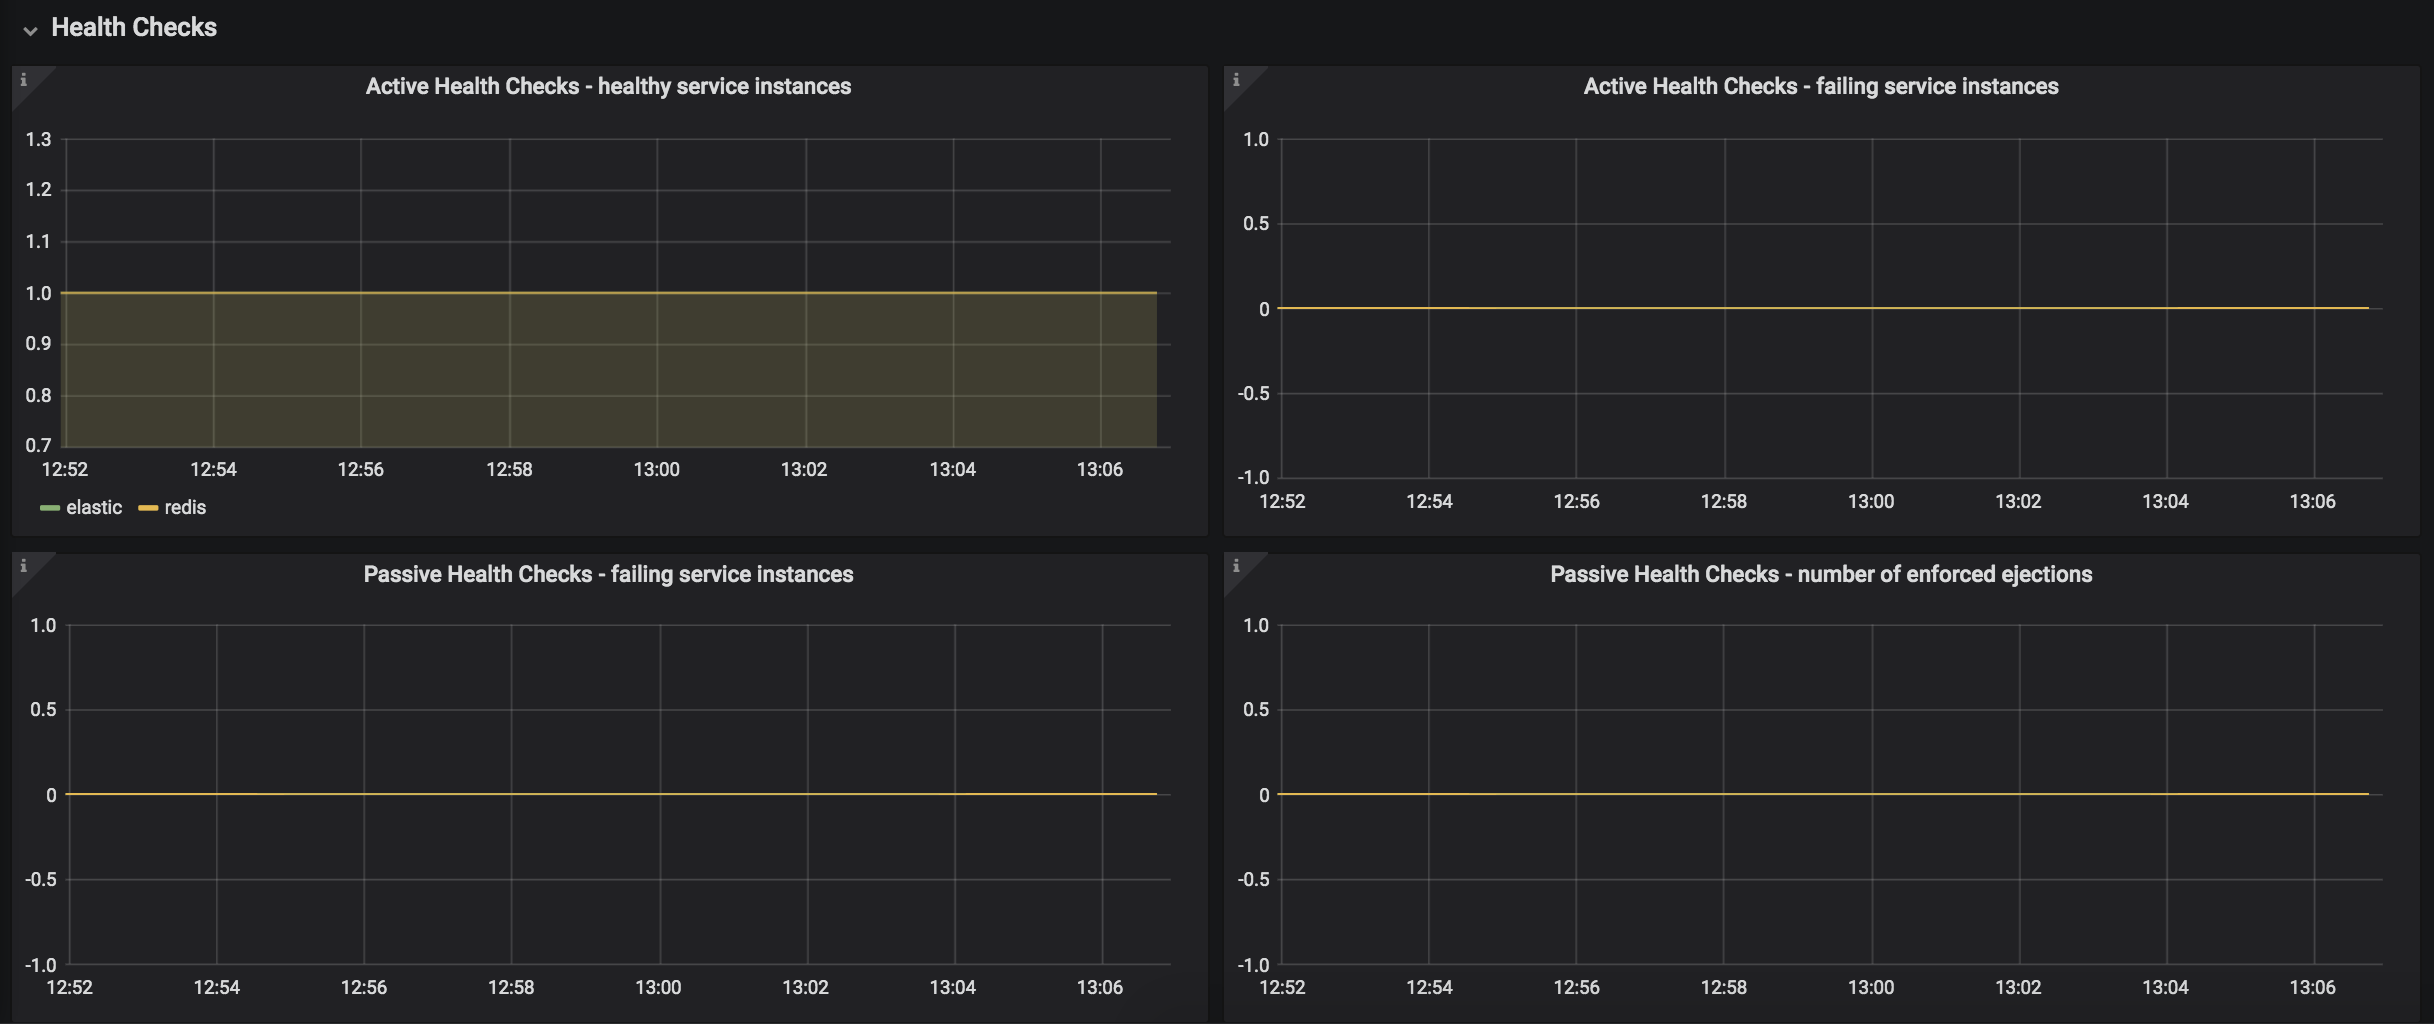
Kuma Dataplane
This dashboard lets you investigate the status of a single dataplane in the mesh. In order to see those metrics, you need to create Traffic Metrics policy first.

Kuma Mesh
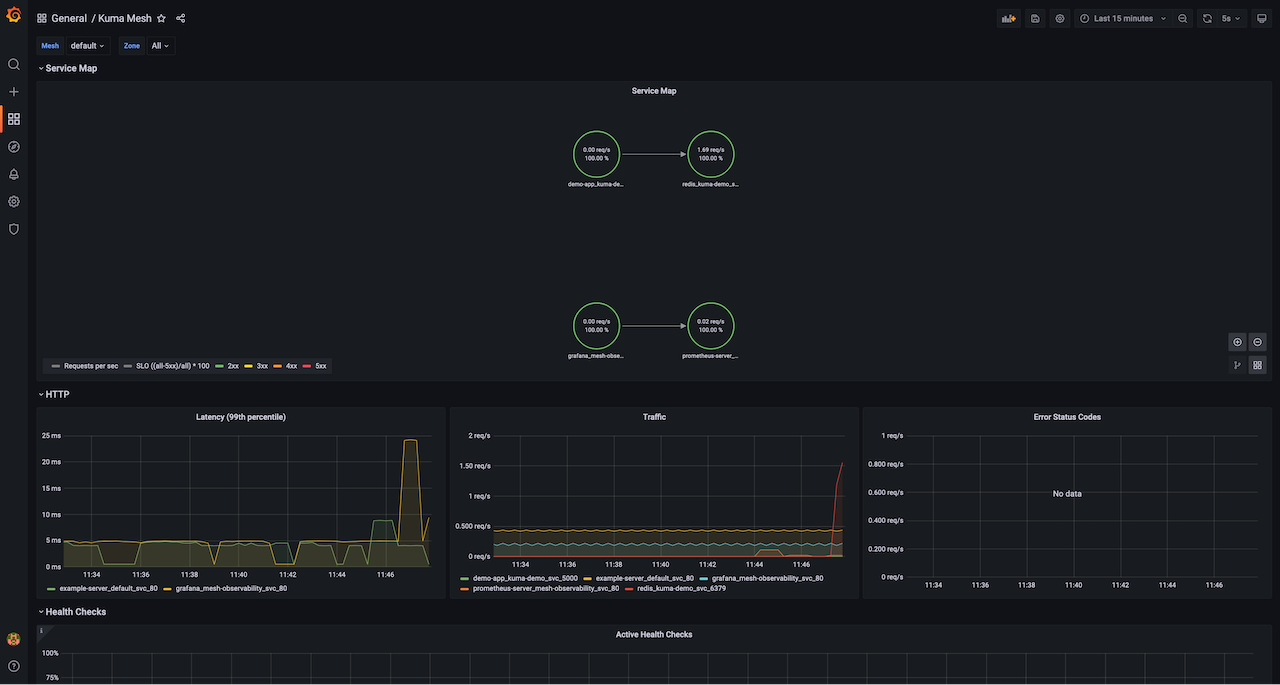
This dashboard lets you investigate the aggregated statistics of a single mesh. It provides a topology view of your service traffic dependencies (Service Map) and includes information such as number of requests and error rates.
Kuma Service to Service
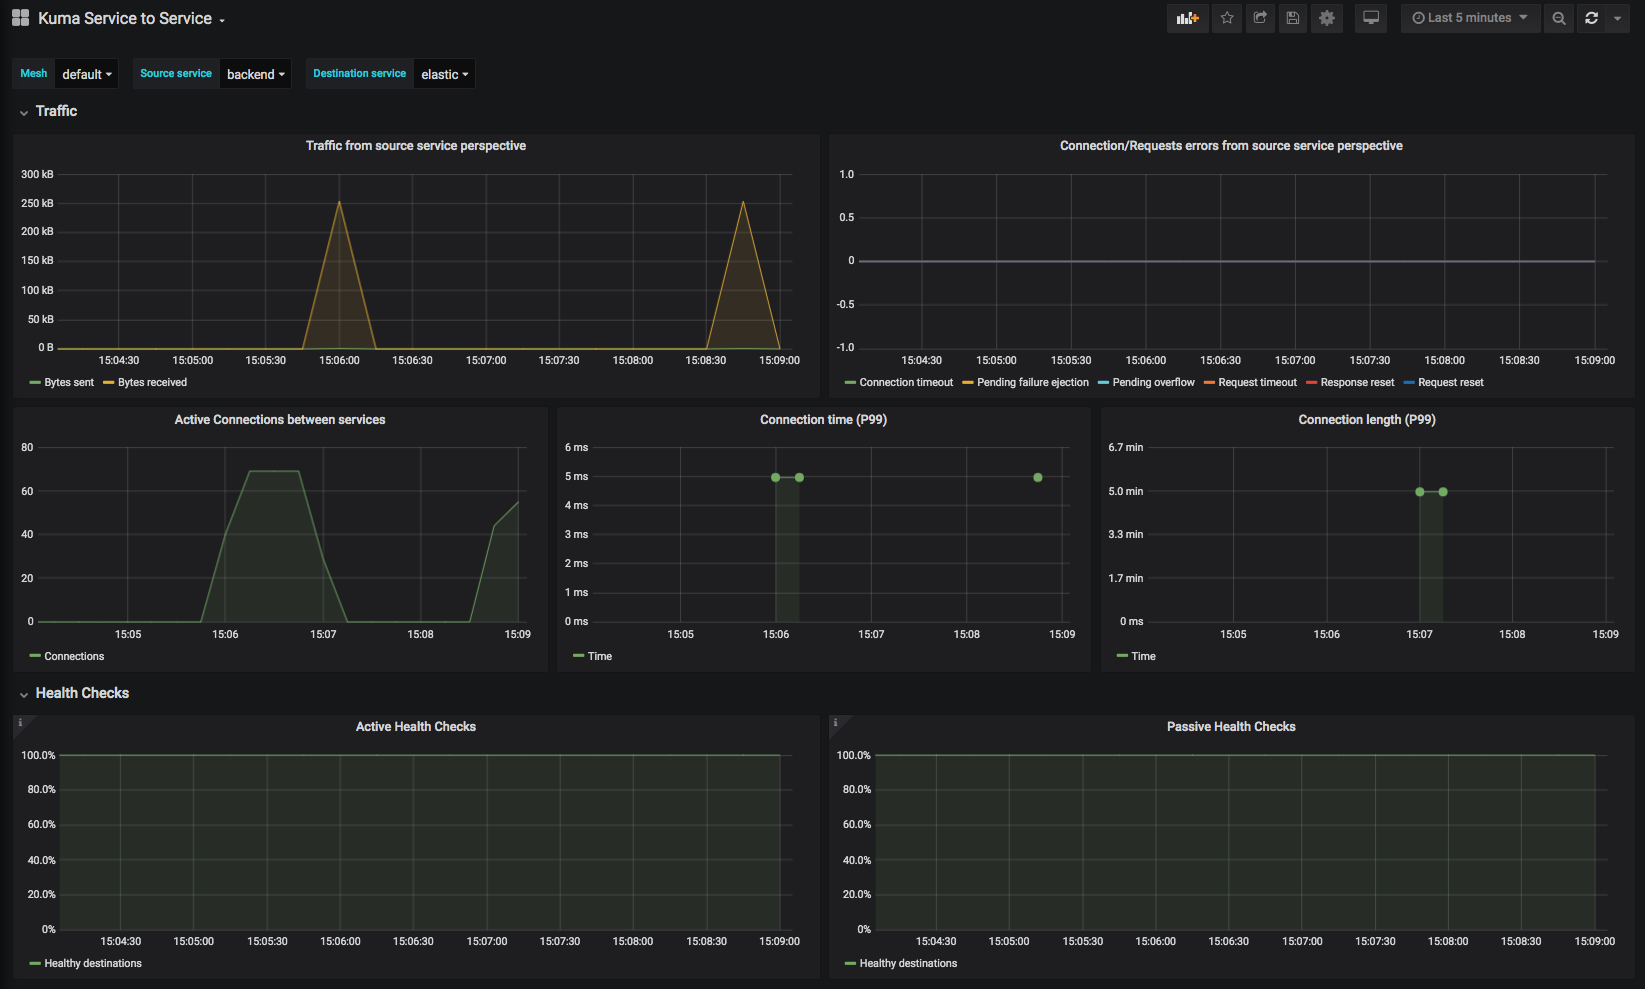
This dashboard lets you investigate aggregated statistics from dataplanes of specified source services to dataplanes of specified destination service.

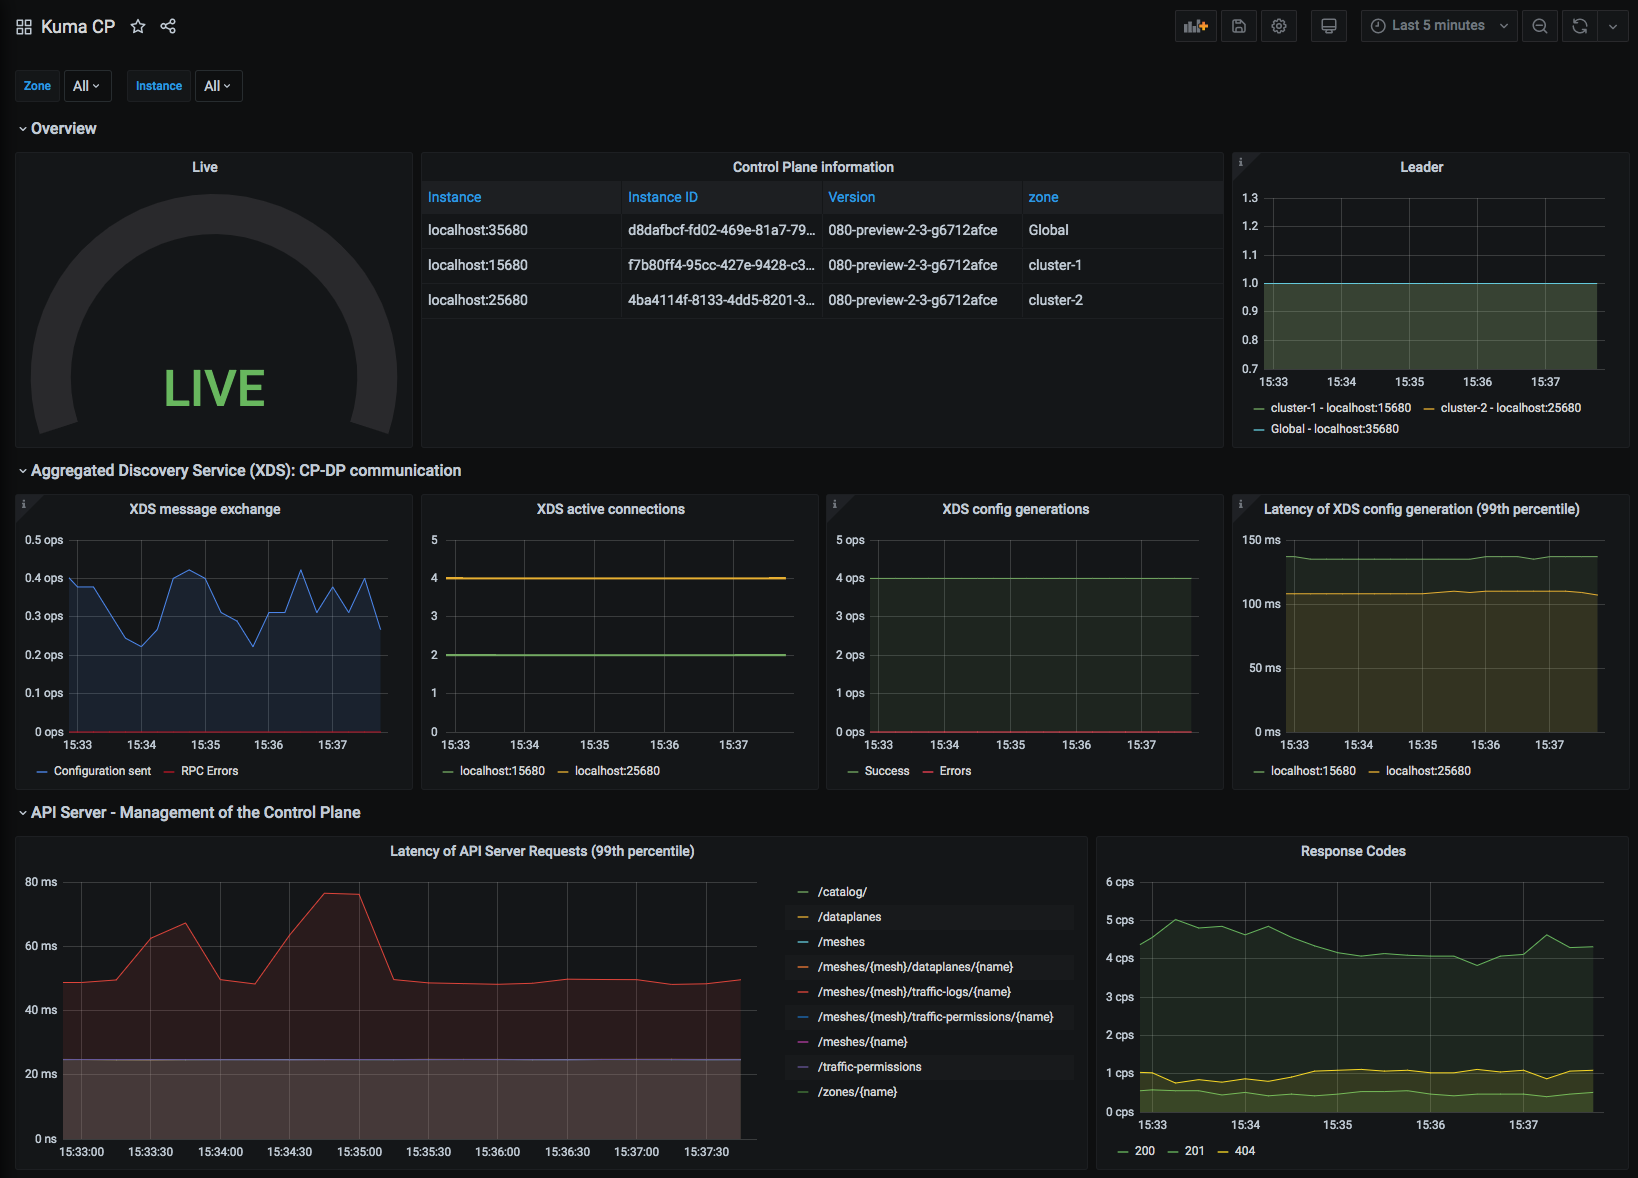
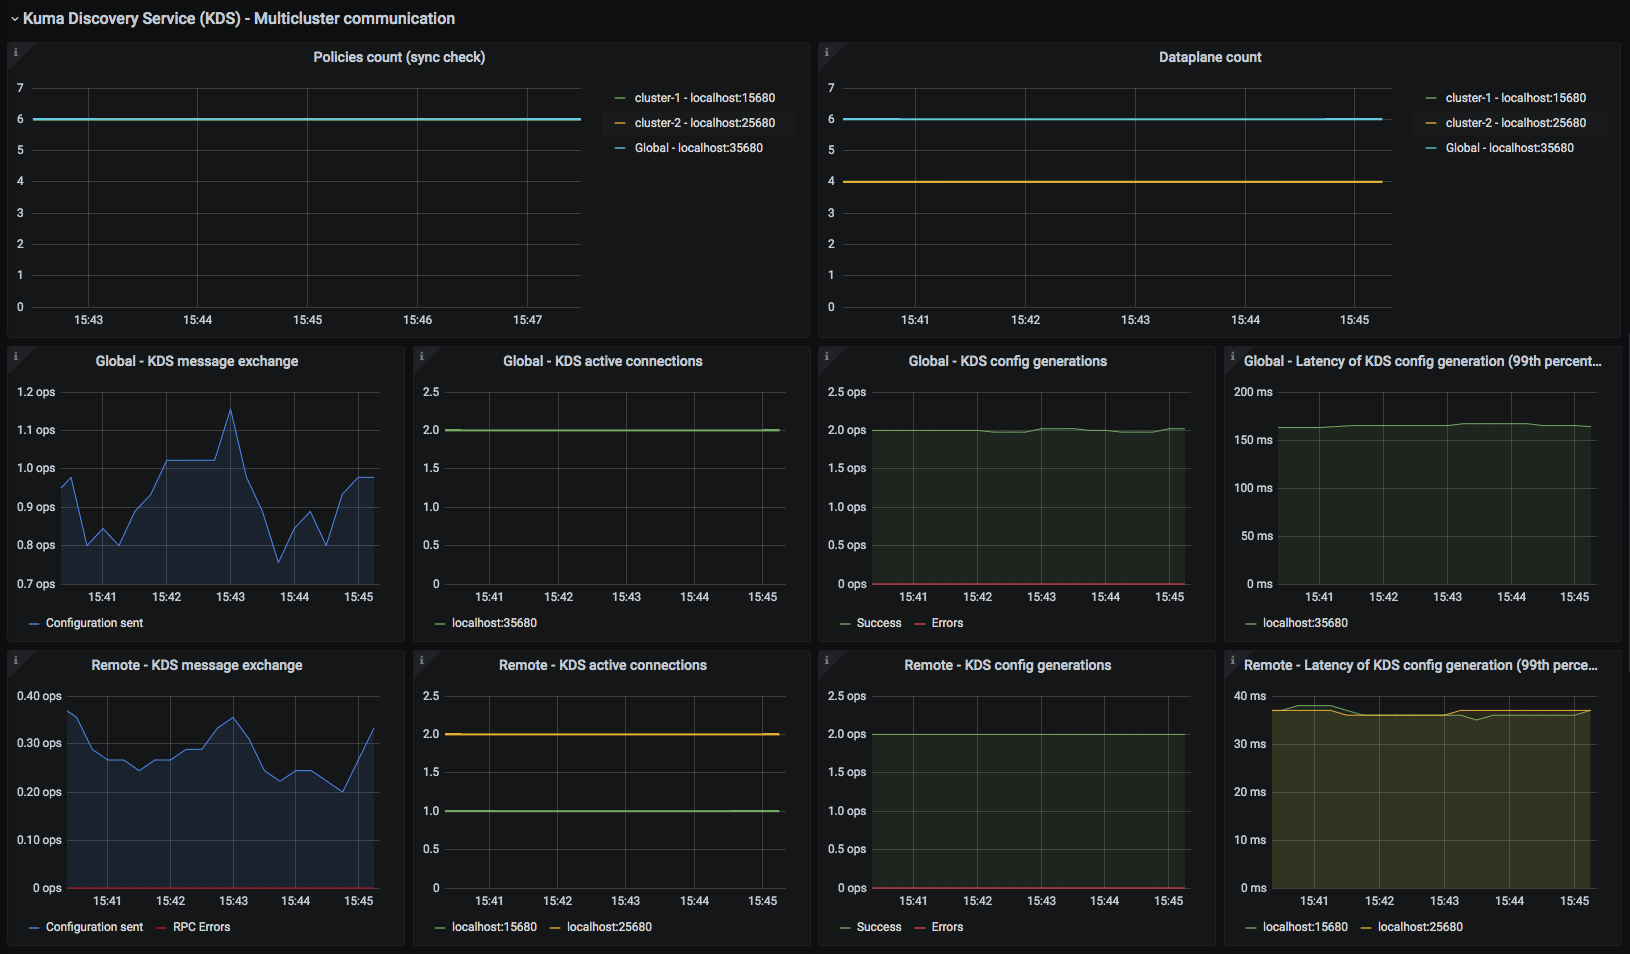
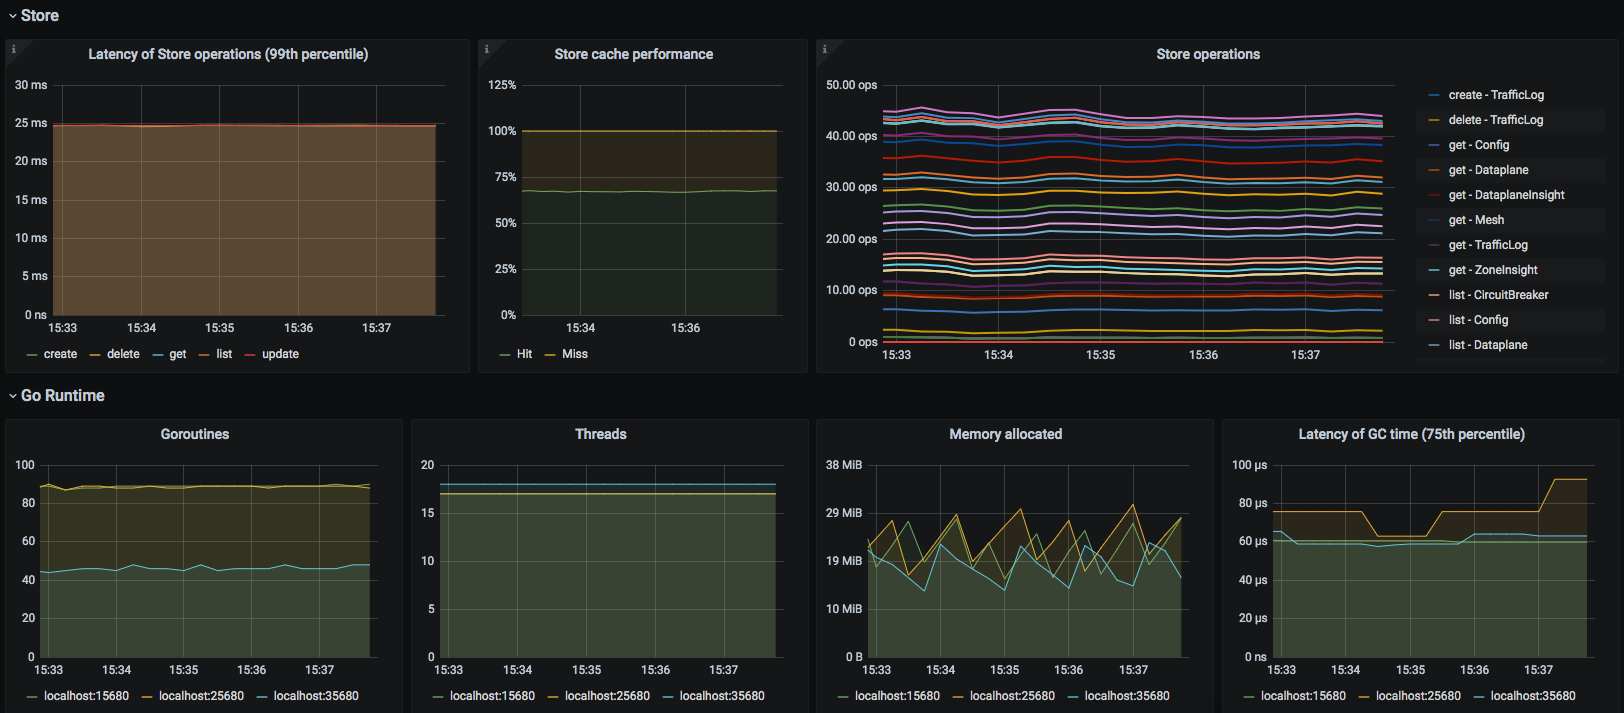
Kuma CP
This dashboard lets you investigate control plane statistics.
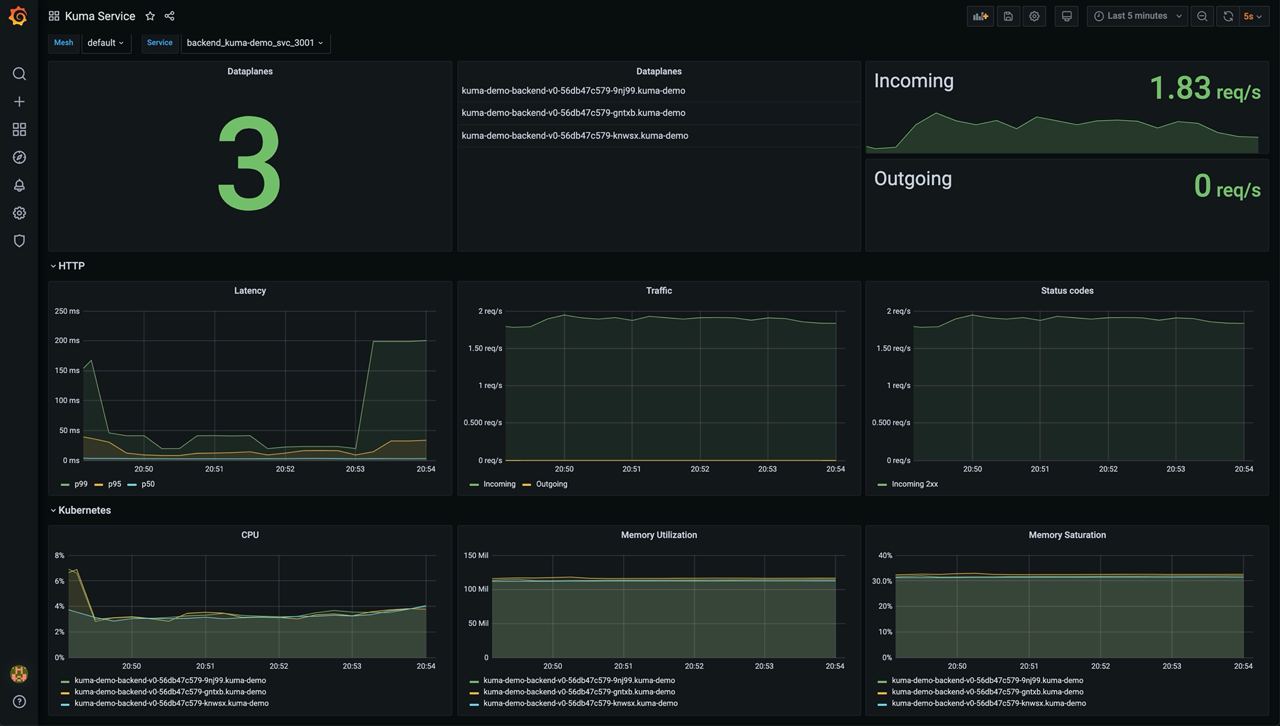
Kuma Service
This dashboard lets you investigate aggregated statistics for each service.
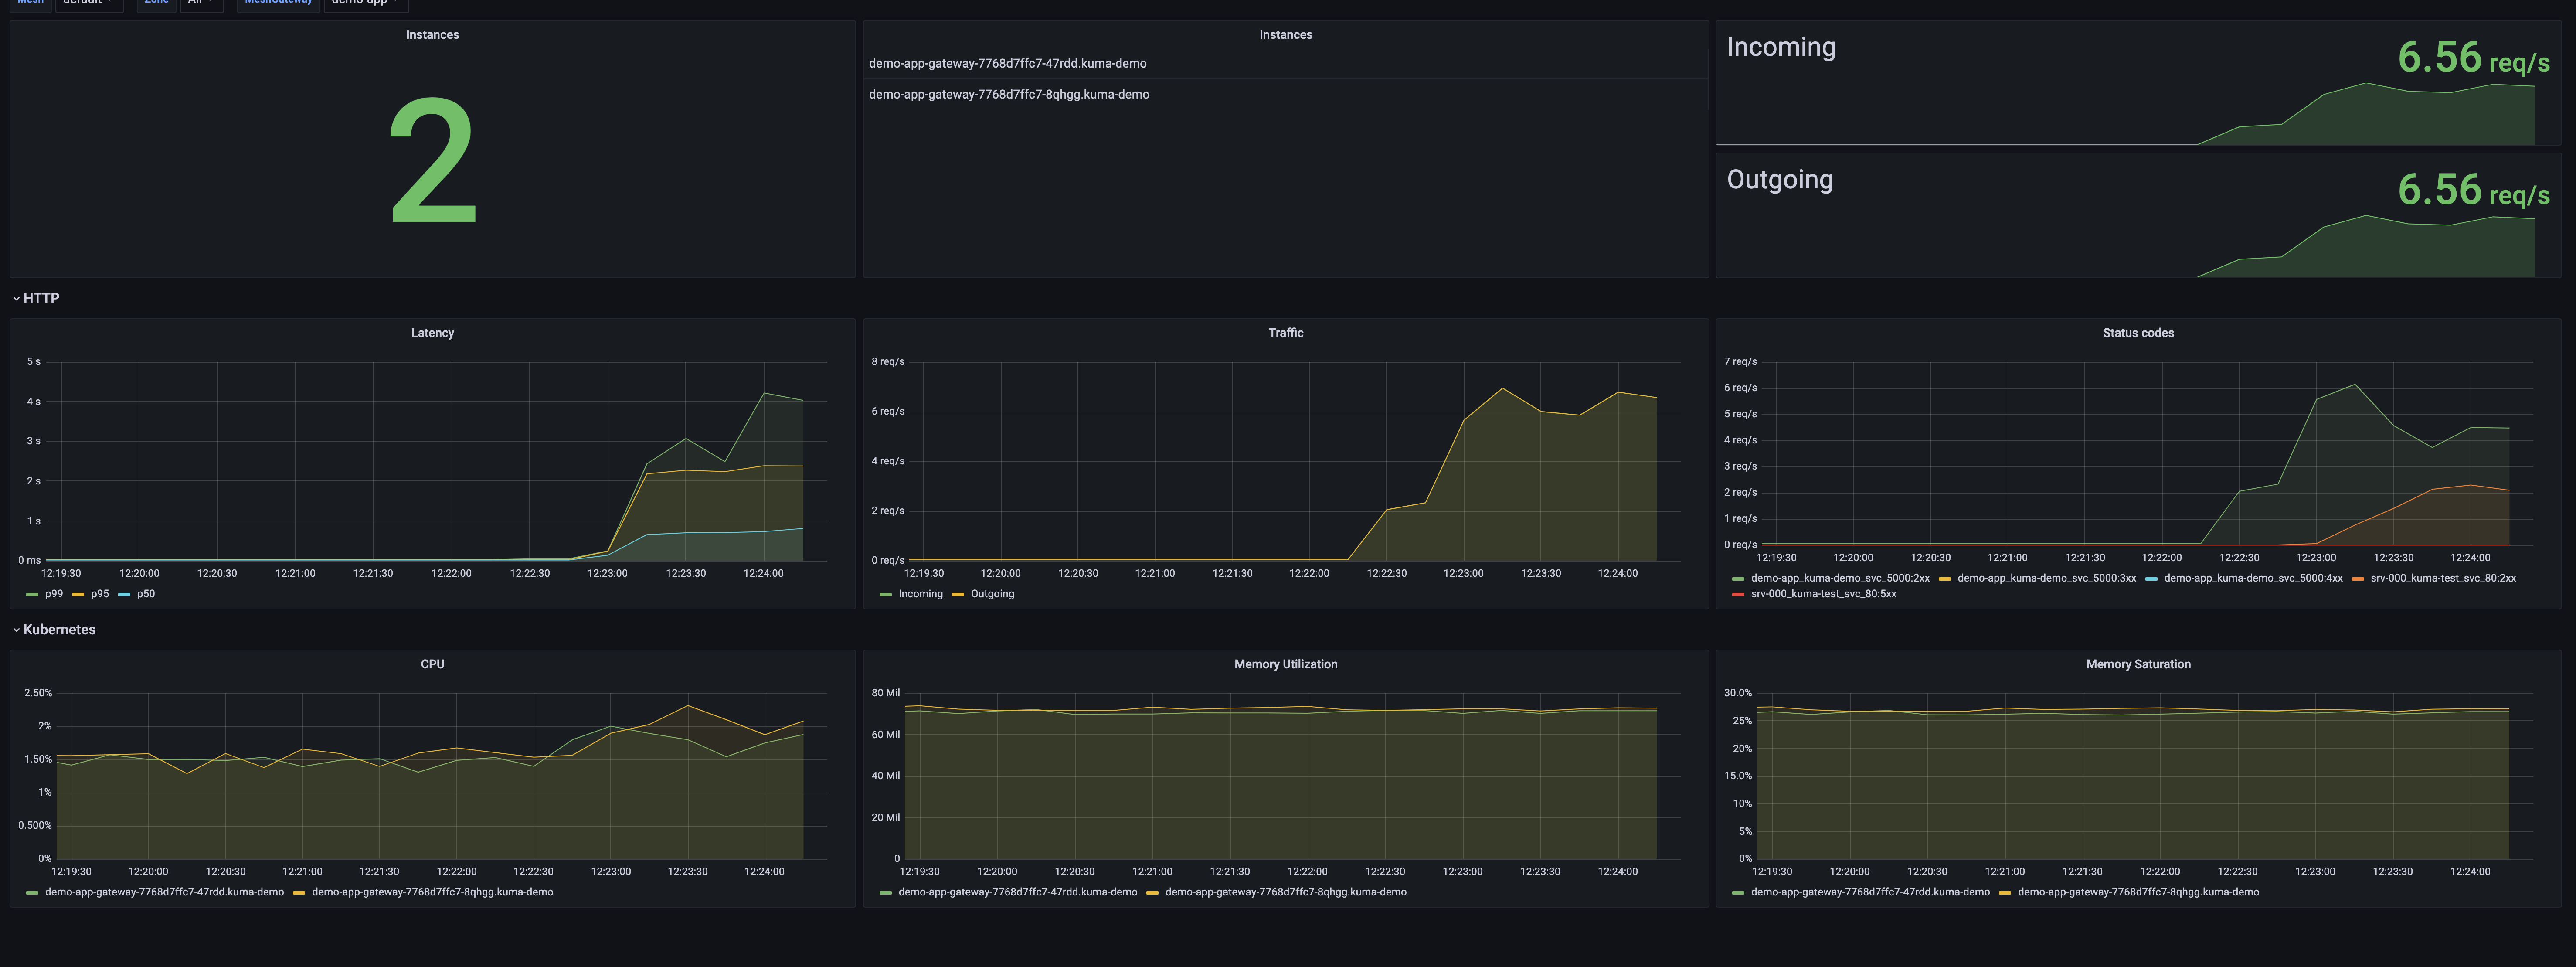
Kuma MeshGateway
This dashboard lets you investigate aggregated statistics for each builtin gateway.
Configuring Datadog
The recommended way to use Datadog is with its agent.
The Datadog agent docs have in-depth installation methods.
Metrics
Kuma exposes metrics with traffic metrics in Prometheus format.
You can add annotations to your pods to enable the Datadog agent to scrape metrics.
Please refer to the dedicated documentation.
Tracing
Checkout the
Configure the Datadog agent for APM.
If Datadog is not running on each node you can expose the APM agent port to Kuma via Kubernetes service.
apiVersion: v1
kind: Service
metadata:
  name: trace-svc
spec:
  selector:
    app.kubernetes.io/name: datadog-agent-deployment
  ports:
    - protocol: TCP
      port: 8126
      targetPort: 8126
Apply the configuration with kubectl apply -f [..].
Check if the label of the datadog pod installed has not changed (app.kubernetes.io/name: datadog-agent-deployment),
if it did adjust accordingly.
Once the agent is configured to ingest traces you’ll need to configure a TrafficTrace.
Logs
The best way to have Kuma and Datadog work together is with TCP ingest.
Once your agent is configured with TCP ingest you can configure a TrafficLog for data plane proxies to send logs.
Observability in multi-zone
Kuma is multi-zone at heart. We explain here how to architect your telemetry stack to accommodate multi-zone.
Prometheus
When Kuma is used in multi-zone the recommended approach is to use 1 Prometheus instance in each zone and to send the metrics of each zone to a global Prometheus instance.
Prometheus offers different ways to do this:
- Federation the global Prometheus will scrape each zone Prometheuses.
- Remote Write each zone Prometheuses will directly write their metrics to the global, this is meant to be more efficient the API the federation.
- Remote Read like remote write but the other way around.
Jaeger, Loki, Datadog and others
Most telemetry components don’t have a hierarchical setup like Prometheus. If you want to have a central view of everything you can set up the system in global and have each zone send their data to it. Because zone is present in data plane tags you shouldn’t be worried about metrics, logs and traces overlapping between zones.
← GUI Inspect API →
