Careful!
You are browsing documentation for a version of Kuma that is not the latest release.
Looking for even older versions? Learn more.
Traffic Trace
This policy enables tracing logging to a third party tracing solution.
Tracing is supported over HTTP, HTTP2, and gRPC protocols in a Mesh. You must explicitly specify the protocol for each service and data plane proxy you want to enable tracing for.
You must also:
- Add a tracing backend. You specify a tracing backend as a
Meshresource property. - Add a TrafficTrace resource. You pass the backend to the
TrafficTraceresource.
Kuma currently supports the following backends:
zipkin- Jaeger as the Zipkin collector. The Zipkin examples specify Jaeger, but you can modify for a Zipkin-only deployment.
datadog
While most commonly we want all the traces to be sent to the same tracing backend, we can optionally create multiple tracing backends in a Mesh resource and store traces for different paths of our service traffic in different backends by leveraging Kuma tags. This is especially useful when we want traces to never leave a world region, or a cloud, for example.
Add Jaeger backend
On Kubernetes you can deploy Jaeger automatically in a kuma-tracing namespace with kumactl install tracing | kubectl apply -f -.
apiVersion: kuma.io/v1alpha1
kind: Mesh
metadata:
  name: default
spec:
  tracing:
    defaultBackend: jaeger-collector
    backends:
      - name: jaeger-collector
        type: zipkin
        sampling: 100.0
        conf:
          url: http://jaeger-collector.kuma-tracing:9411/api/v2/spans
Apply the configuration with kubectl apply -f [..].
Add Datadog backend
Prerequisites
- Set up the Datadog agent.
- Set up APM.
- For Kubernetes, see the datadog documentation for setting up Kubernetes.
If Datadog is running within Kubernetes, you can expose the APM agent port to Kuma via Kubernetes service.
apiVersion: v1
kind: Service
metadata:
  name: trace-svc
spec:
  selector:
    app.kubernetes.io/name: datadog-agent-deployment
  ports:
    - protocol: TCP
      port: 8126
      targetPort: 8126
Apply the configuration with kubectl apply -f [..].
Check if the label of the datadog pod installed has not changed (app.kubernetes.io/name: datadog-agent-deployment),
if it did adjust accordingly.
Set up in Kuma
apiVersion: kuma.io/v1alpha1
kind: Mesh
metadata:
  name: default
spec:
  tracing:
    defaultBackend: datadog-collector
    backends:
      - name: datadog-collector
        type: datadog
        sampling: 100.0
        conf:
          address: trace-svc.datadog.svc.cluster.local
          port: 8126
where trace-svc is the name of the Kubernetes Service you specified when you configured the Datadog APM agent.
Apply the configuration with kubectl apply -f [..].
The defaultBackend property specifies the tracing backend to use if it’s not explicitly specified in the TrafficTrace resource.
Add TrafficTrace resource
Next, create TrafficTrace resources that specify how to collect traces, and which backend to store them in.
apiVersion: kuma.io/v1alpha1
kind: TrafficTrace
mesh: default
metadata:
  name: trace-all-traffic
spec:
  selectors:
    - match:
        kuma.io/service: "*"
  conf:
    backend: jaeger-collector # or the name of any backend defined for the mesh
Apply the configuration with kubectl apply -f [..].
You can also add tags to apply the TrafficTrace resource only a subset of data plane proxies. TrafficTrace is a Dataplane policy, so you can specify any of the selectors tags.
Services should also be instrumented to preserve the trace chain across requests made across different services. You can instrument with a language library of your choice, or you can manually pass the following headers:
x-request-idx-b3-traceidx-b3-parentspanidx-b3-spanidx-b3-sampledx-b3-flags
Configure Grafana to visualize the logs
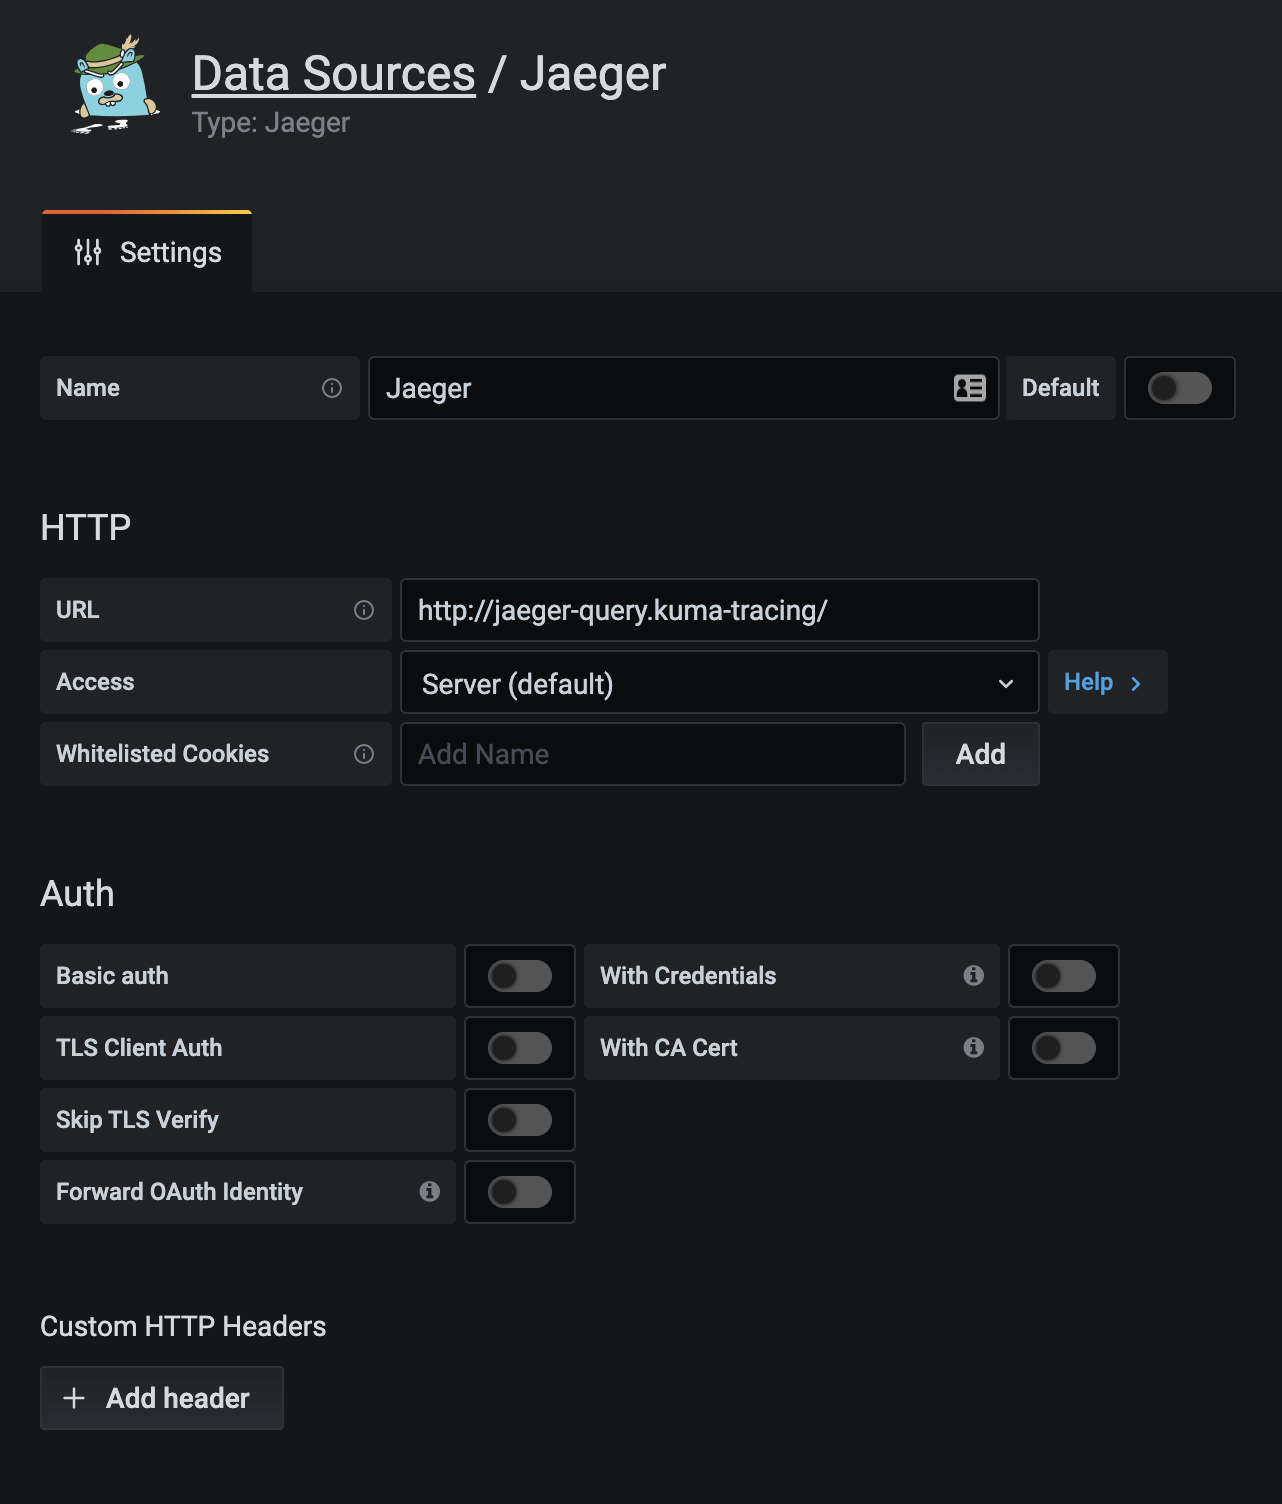
To visualise your traces you need to have a Grafana up and running. You can install Grafana by following the information of the official page or use the one installed with Traffic metrics.
With Grafana installed you can configure a new datasource with url:http://jaeger-query.kuma-tracing/ so Grafana will be able to retrieve the traces from Jaeger.

