Careful!
You are browsing documentation for a version of Kuma that is not the latest release.
Looking for even older versions? Learn more.
GUI
Kuma now ships with a basic web-based GUI that will serve as a visual overview of your dataplanes, meshes, and various traffic policies.
The GUI pairs with the HTTP API — Read more about the HTTP API here
When launching Kuma, the GUI will start by default on the API port, and defaults to :5681/gui. You can access it in your web browser by going to http://localhost:5681/gui.
Getting Started
When you run the GUI for the first time, you’ll be presented with the Wizard:
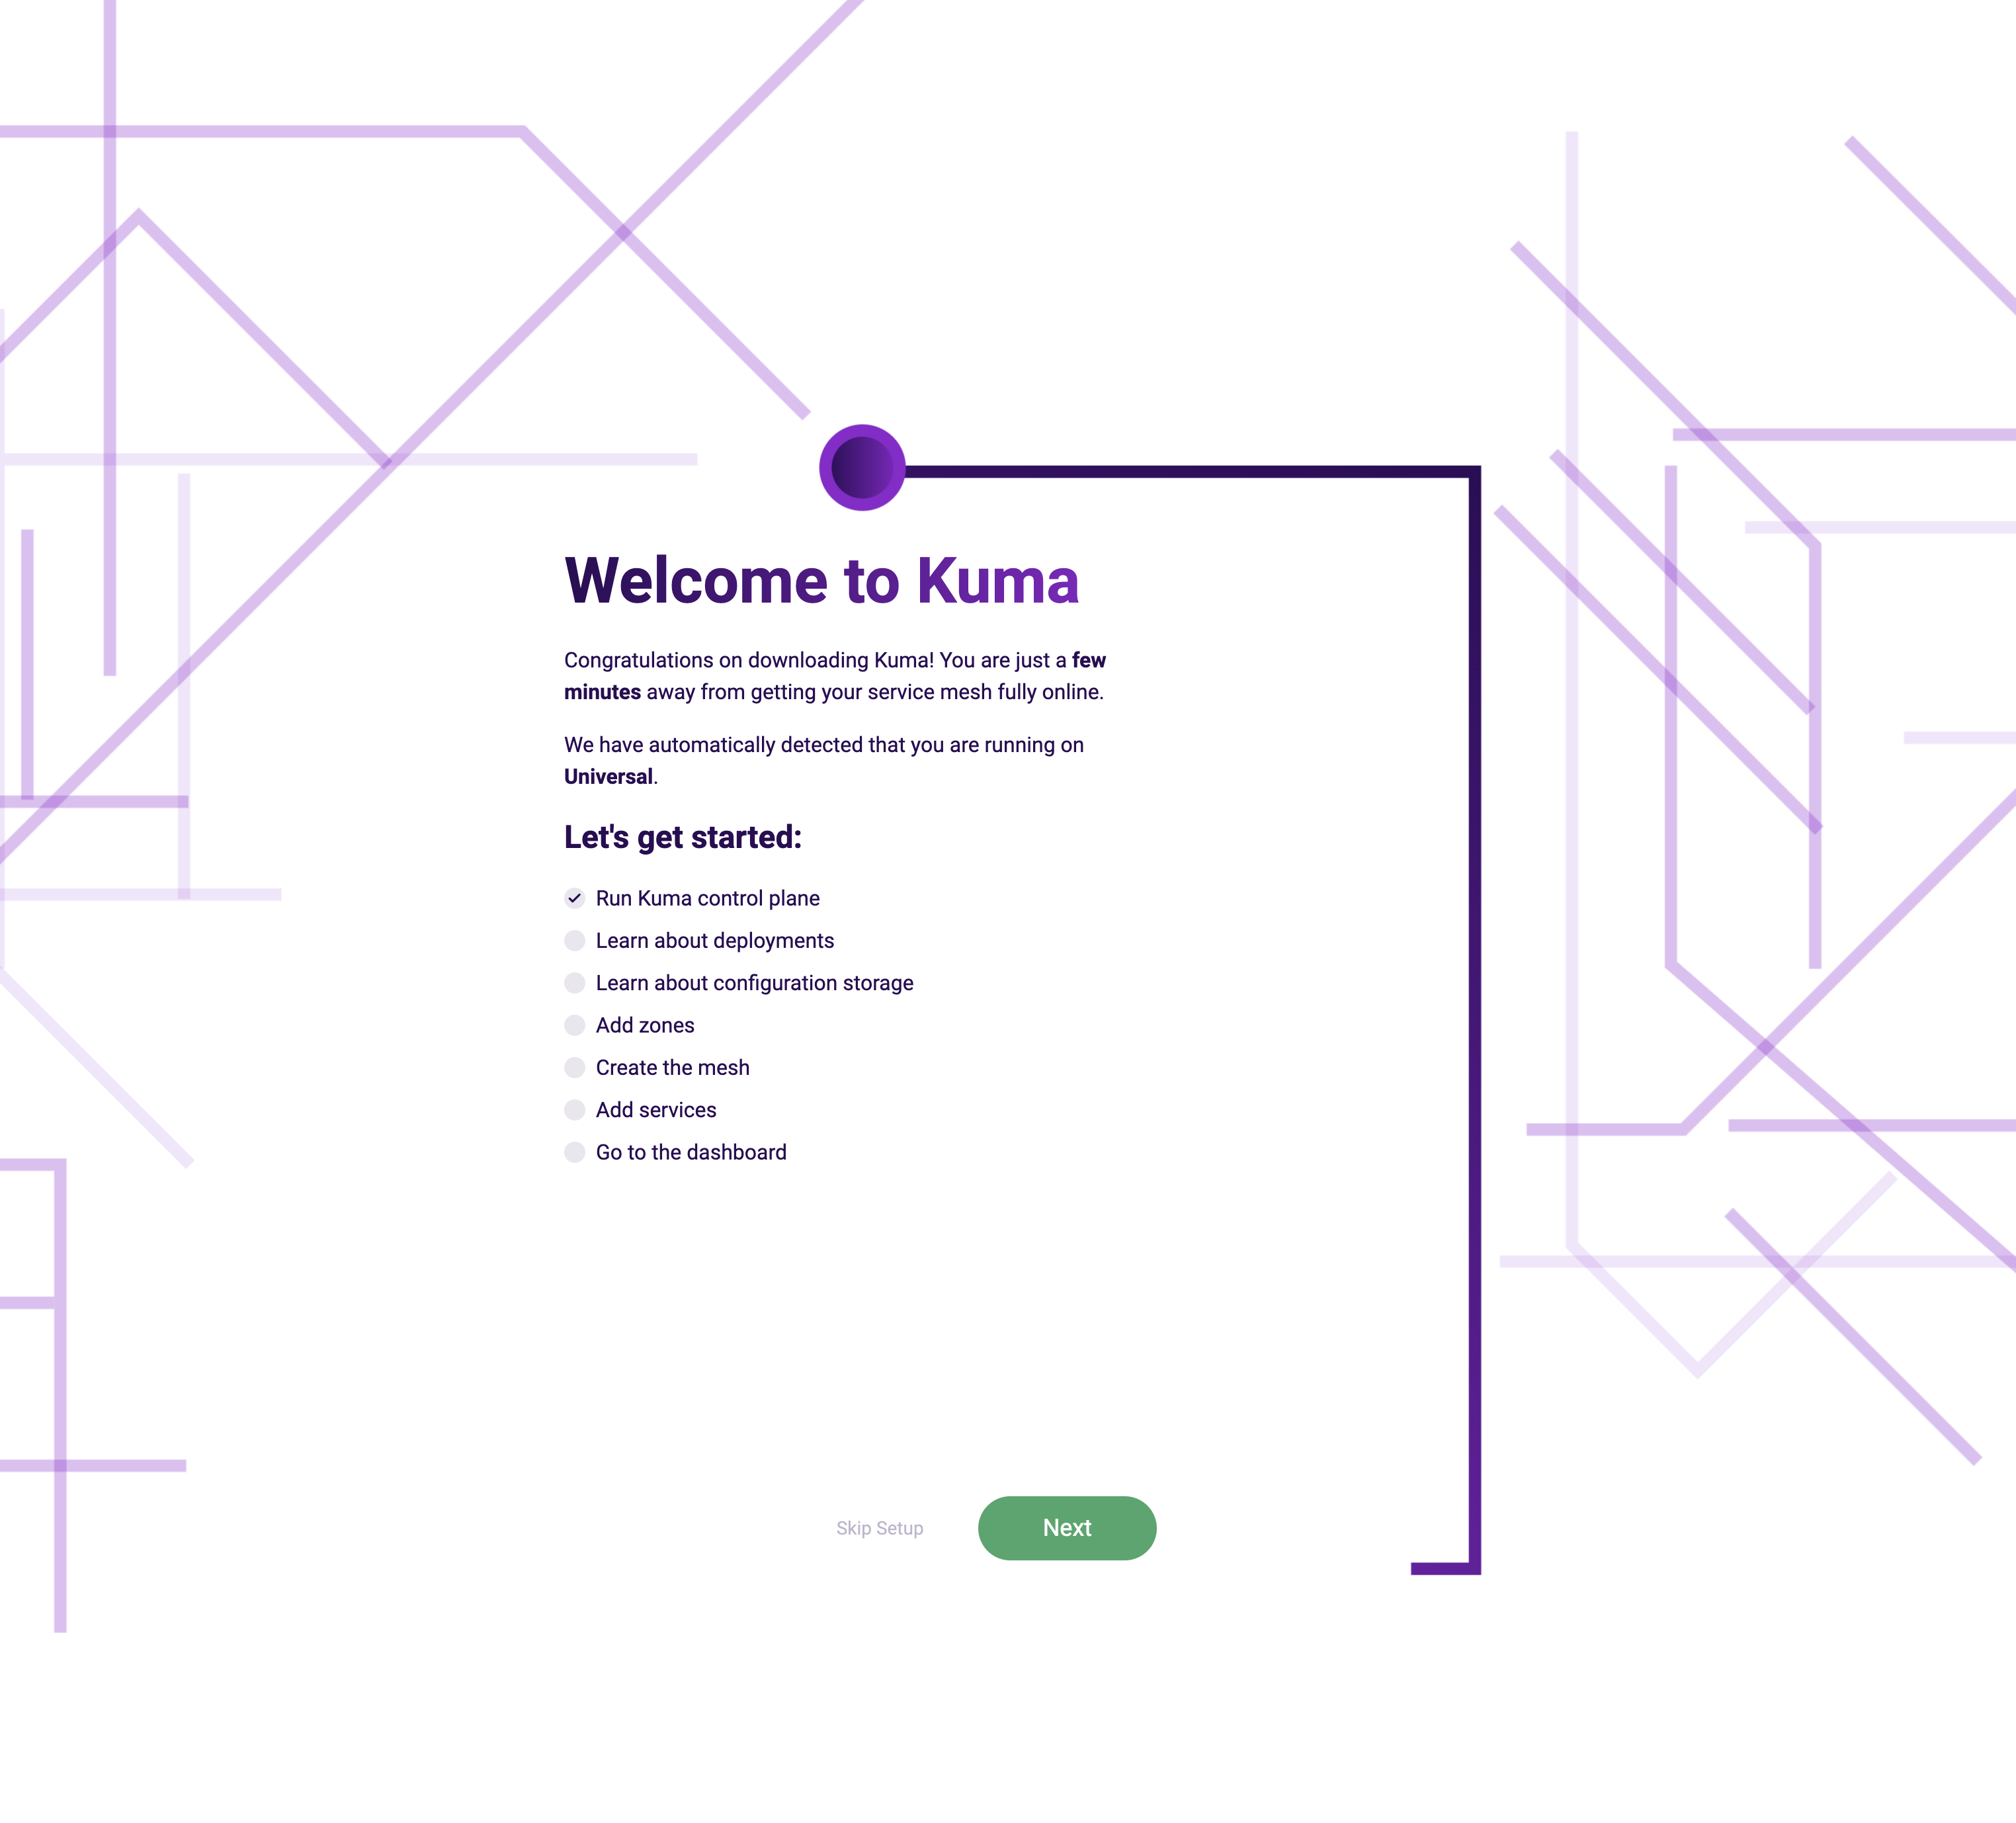
This tool will:
- Confirm that Kuma is running
- Determine if your environment is either Universal or Kubernetes
- Provide instructions on how to add dataplanes (if none have yet been added). The instructions provided will be based on your Kuma environment – Universal or Kubernetes
- Provide a short list of dataplanes found and their status (online or offline), in order to confirm that things are working accordingly and the app can display information
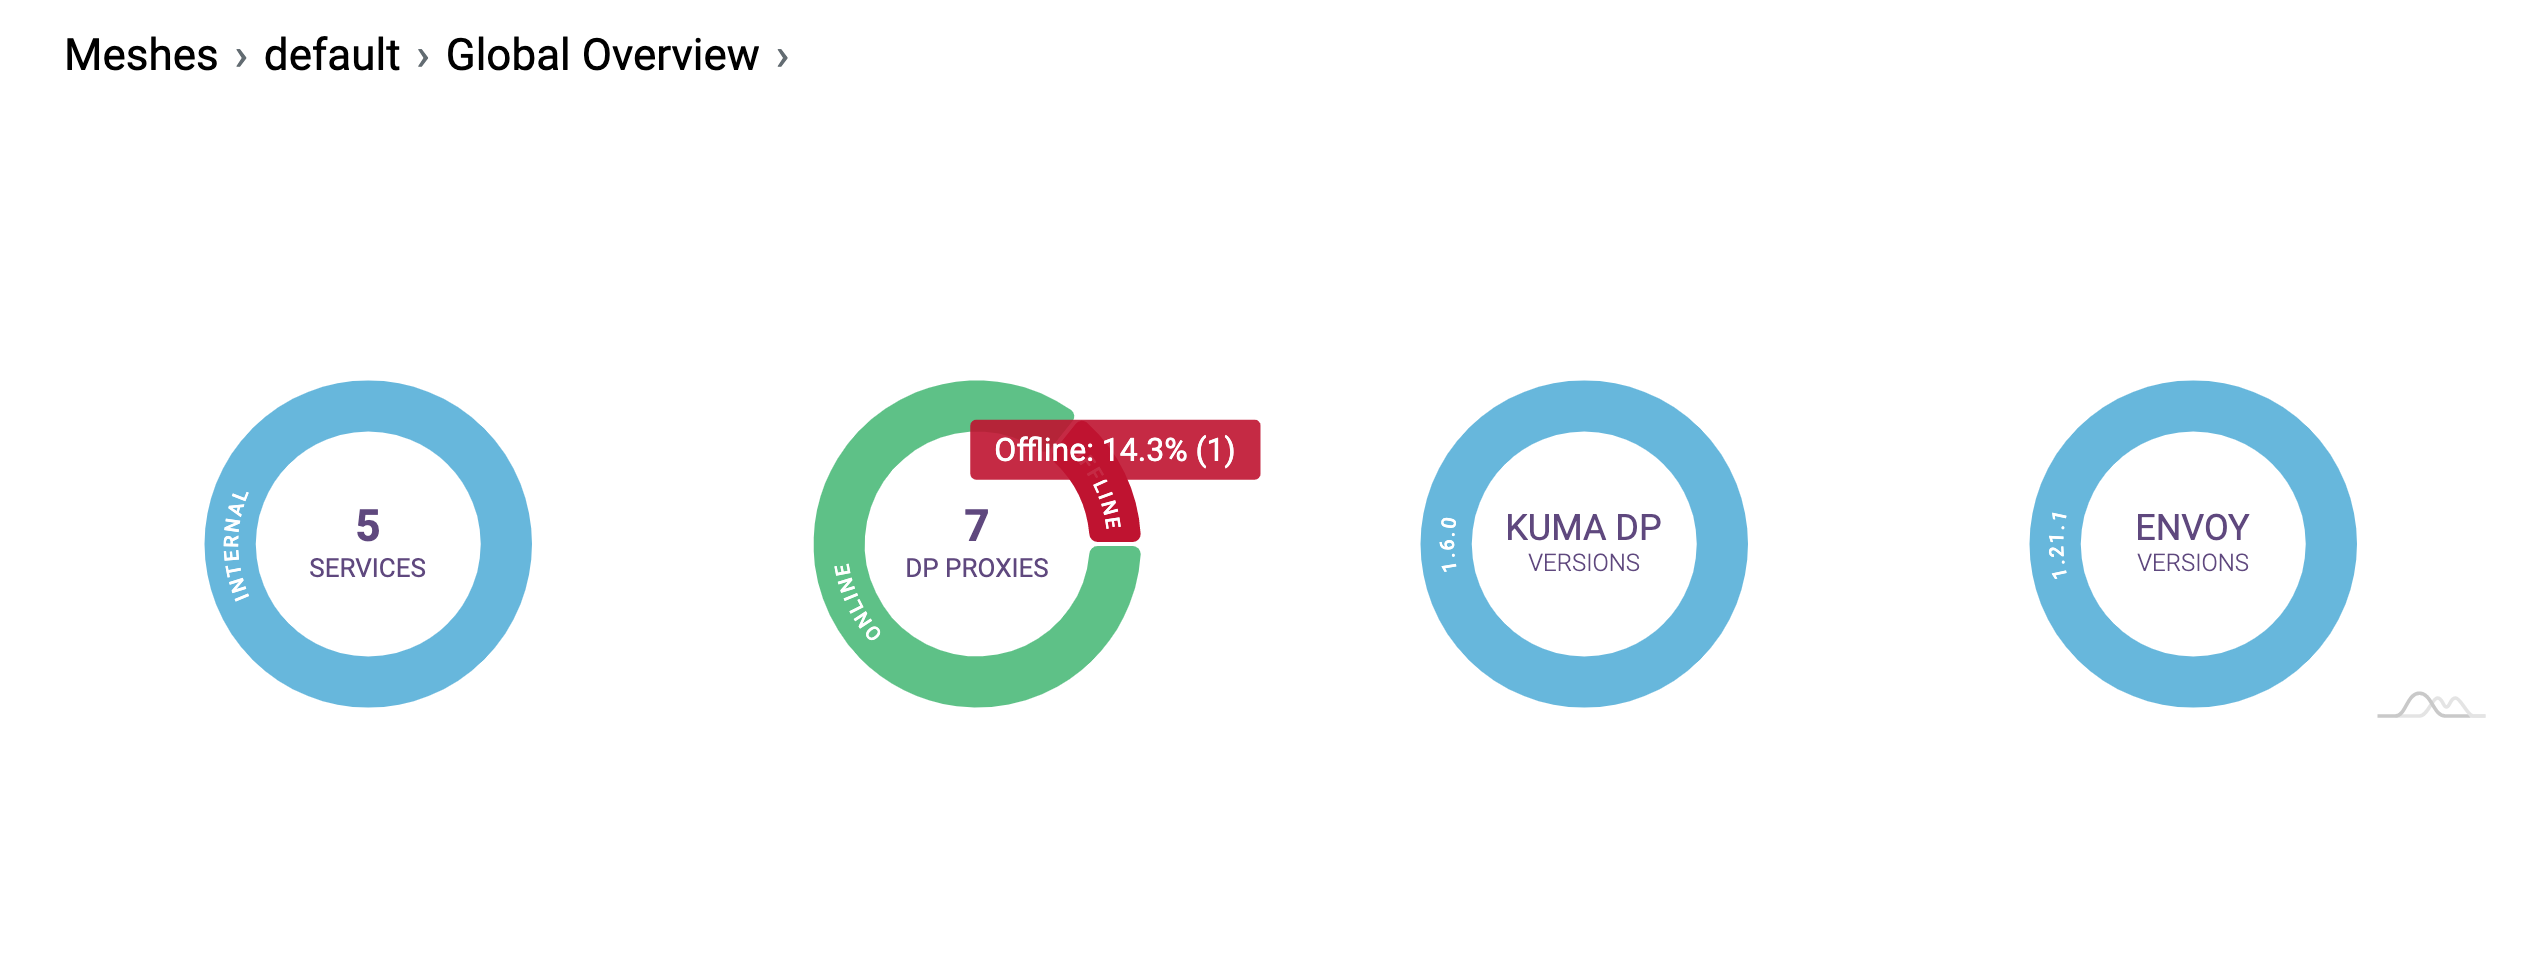
Mesh Overview
Once you’ve completed the setup process, you’ll be sent to the Mesh Overview. This is a general overview of all of the meshes found. You can then view each entity and see how many dataplanes and traffic permissions, routes, and logs are associated with that mesh.
Mesh Details
If you want to view information regarding a specific mesh, you can select the desired mesh from the pulldown at the top of the sidebar. You can then click on any of the overviews in the sidebar to view the entities and policies associated with that mesh.
If you haven’t yet created any meshes, this will default to the default mesh.
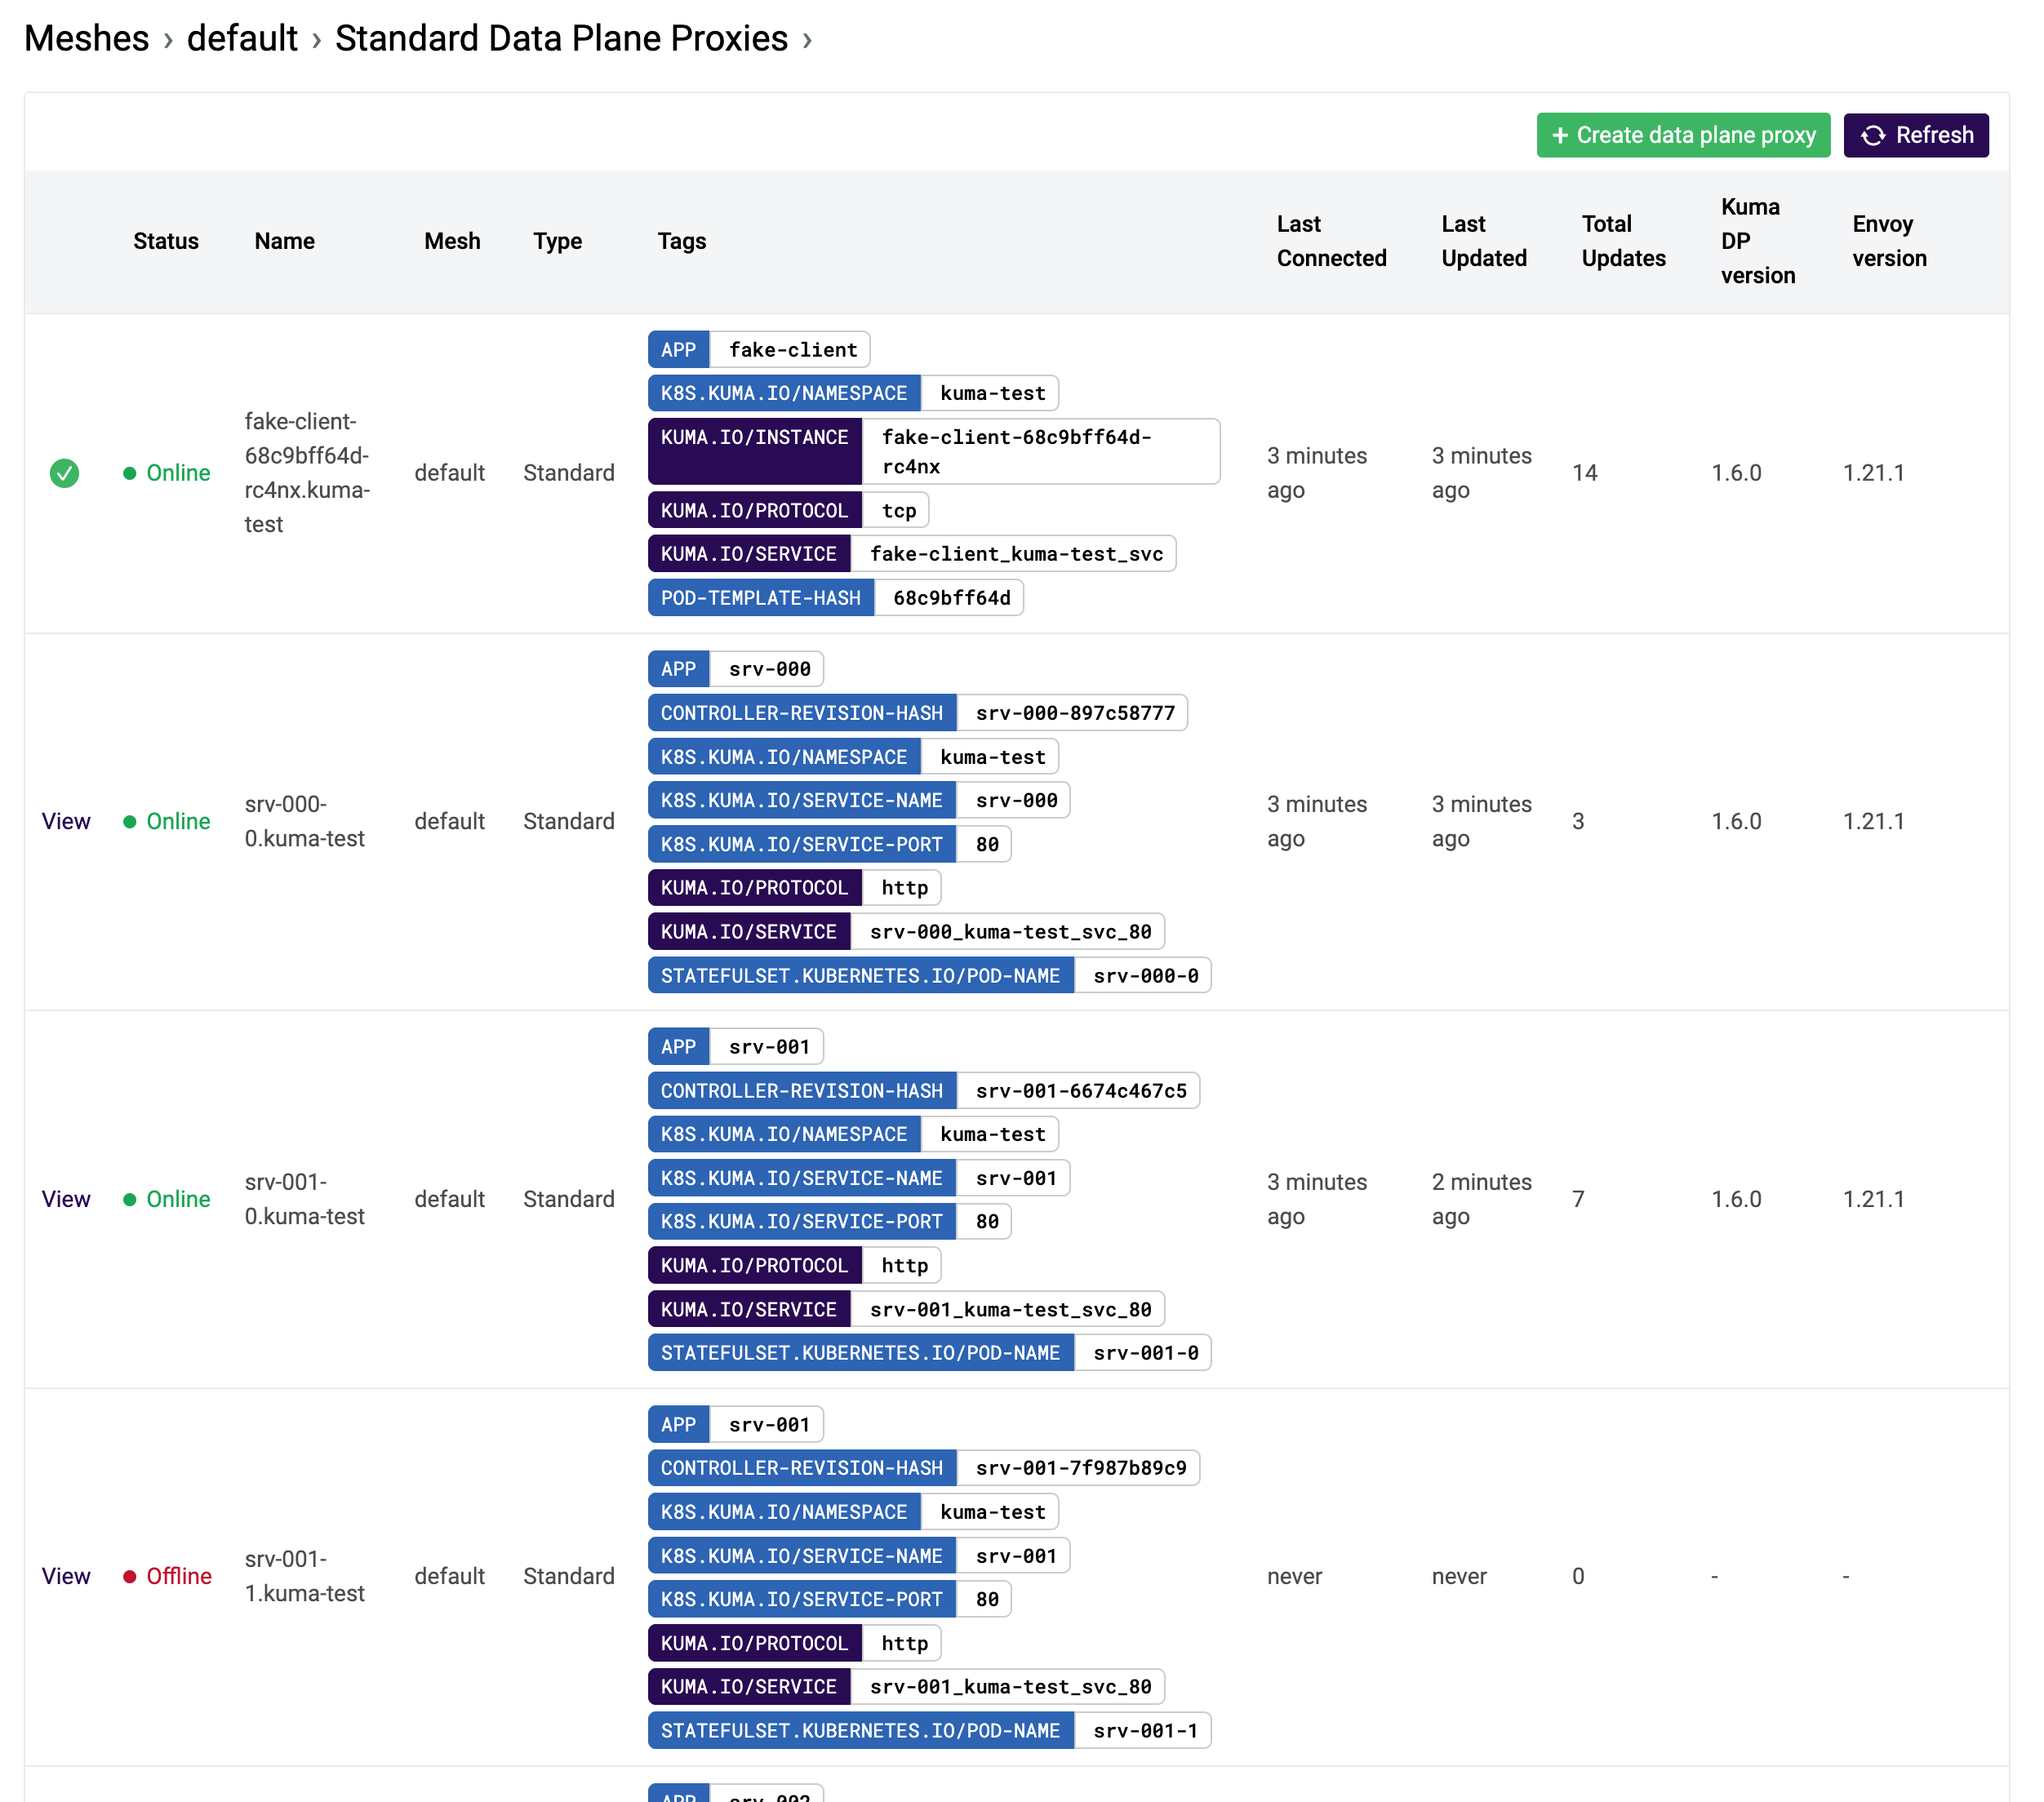
Each of these views will provide you with a table that displays helpful at-a-glance information. The Dataplanes table will display helpful information, including whether a dataplane is online, when it was last connected, how many connections it has, etc. This view also provides a control for refreshing your data on the fly without having to do a full page reload each time you’ve made changes:
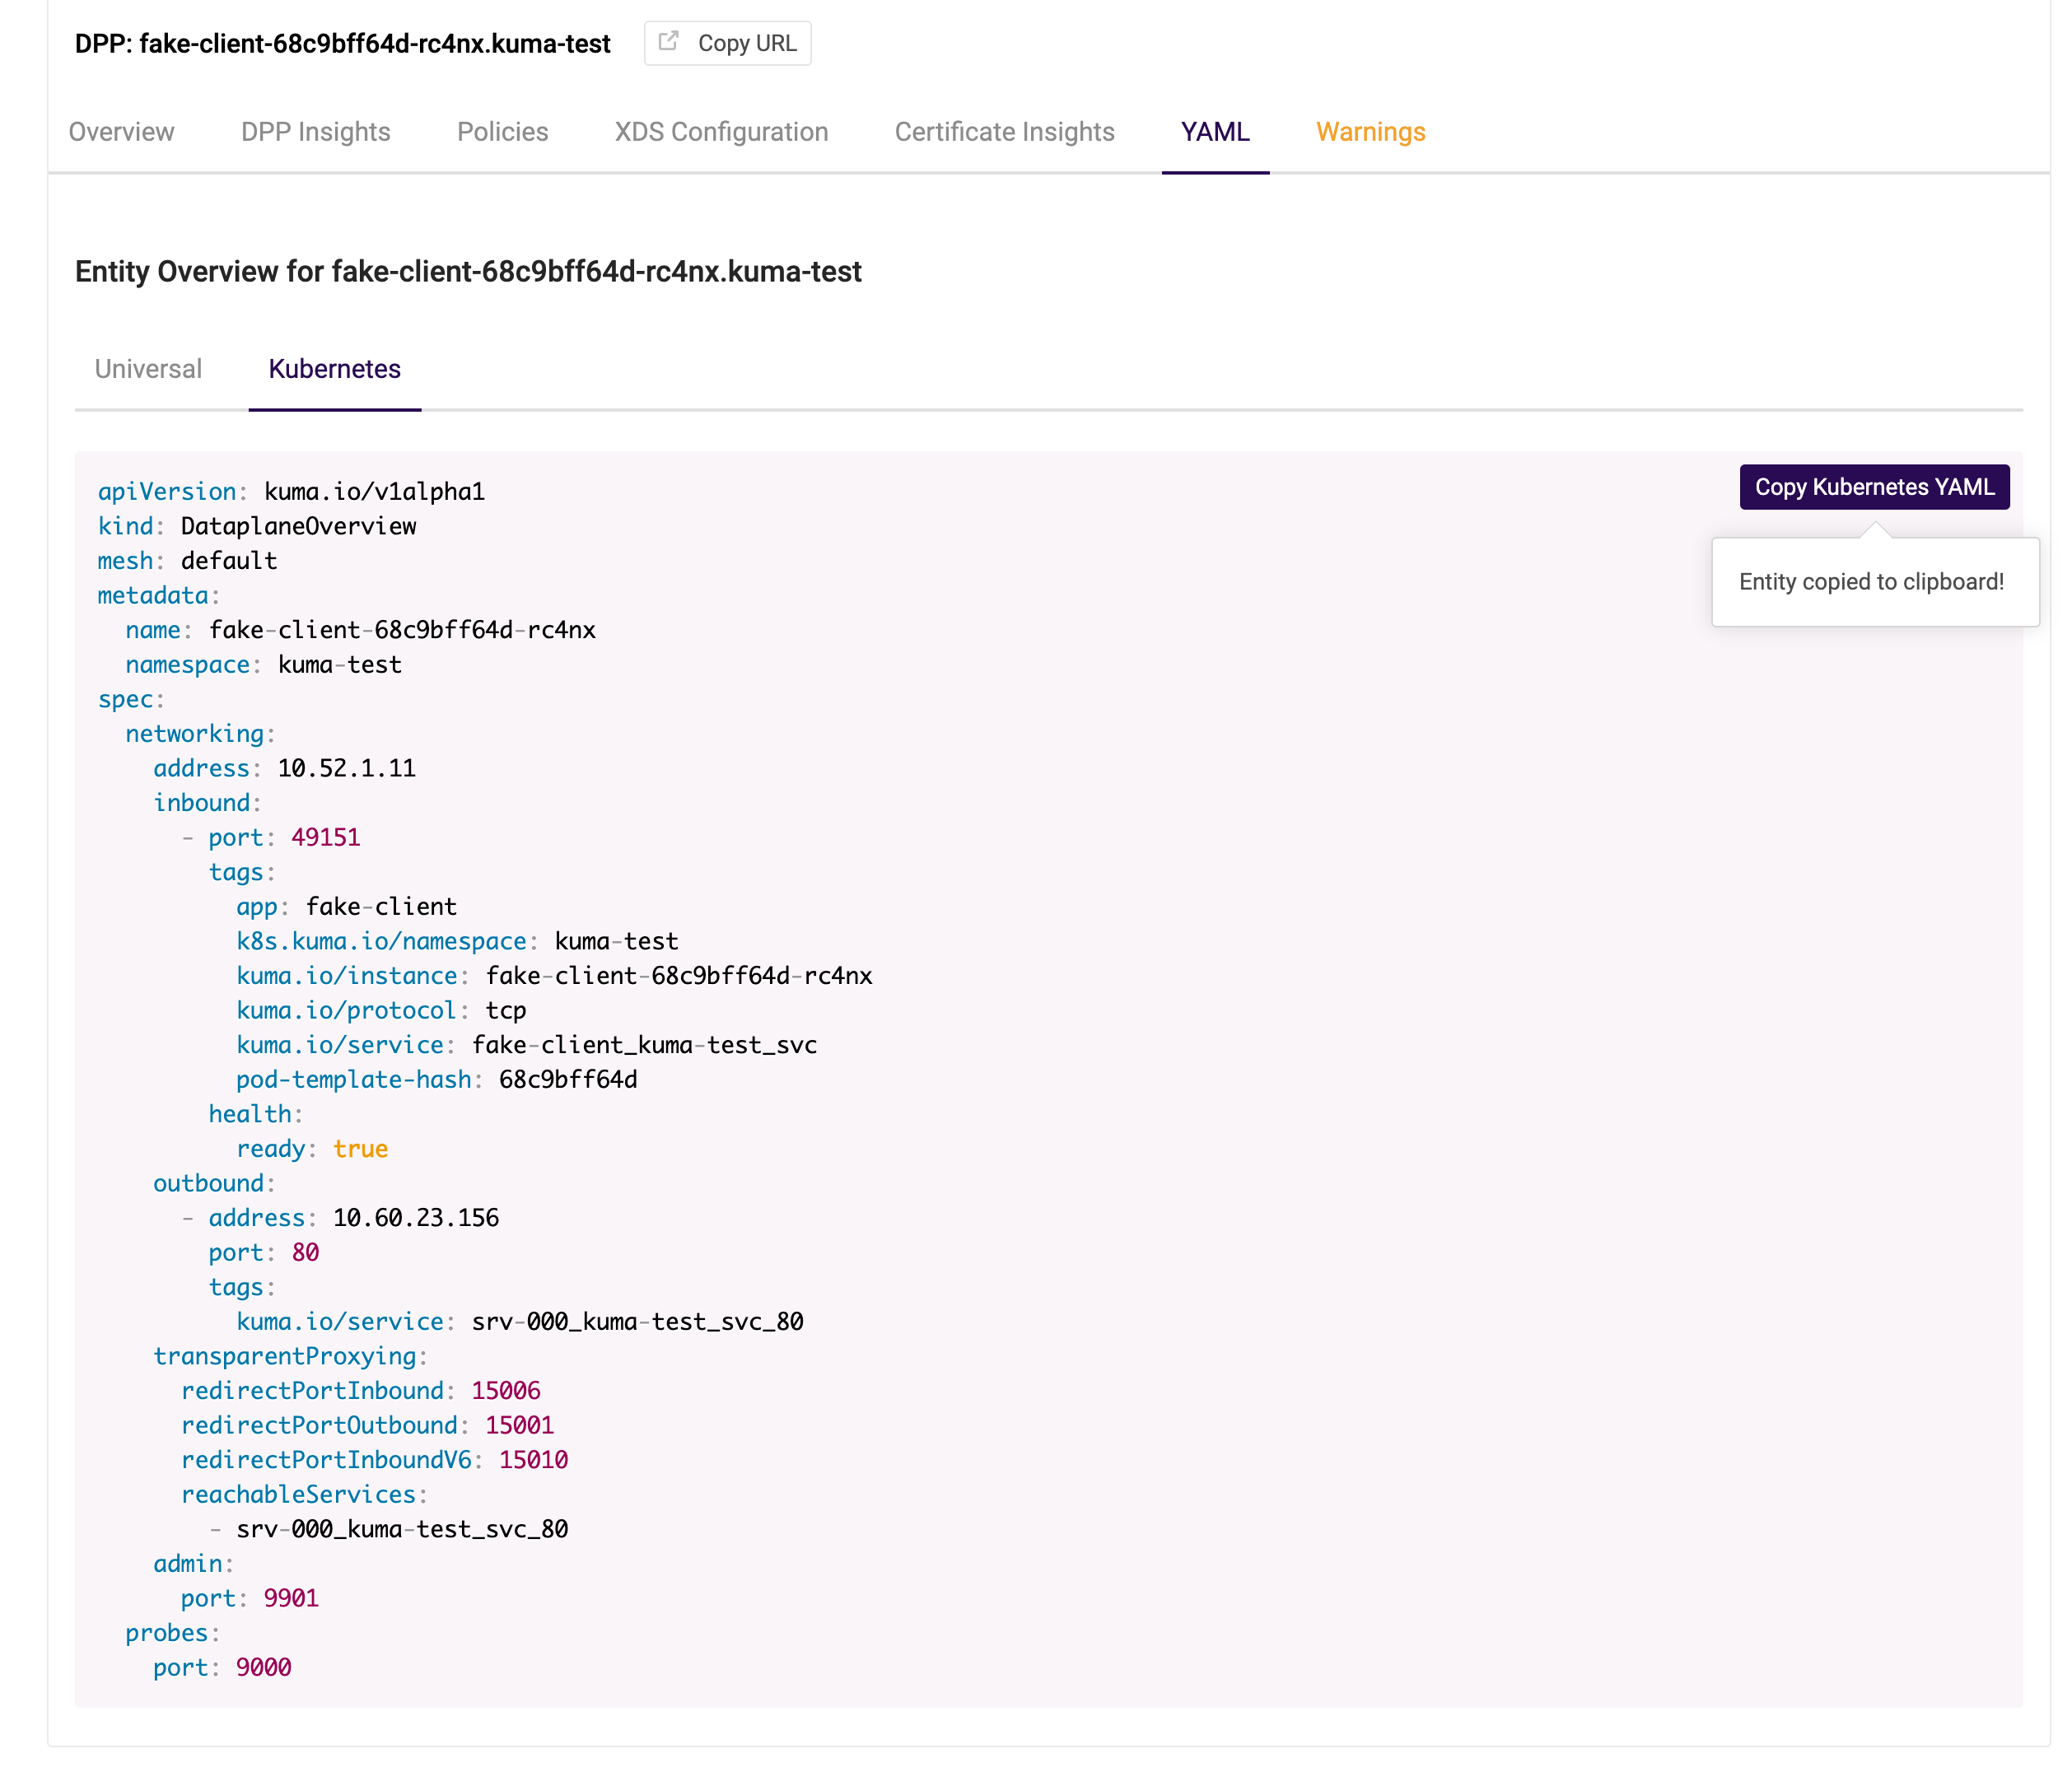
We also provide an easy way to view your entity in YAML format, as well as a control to copy it to your clipboard:
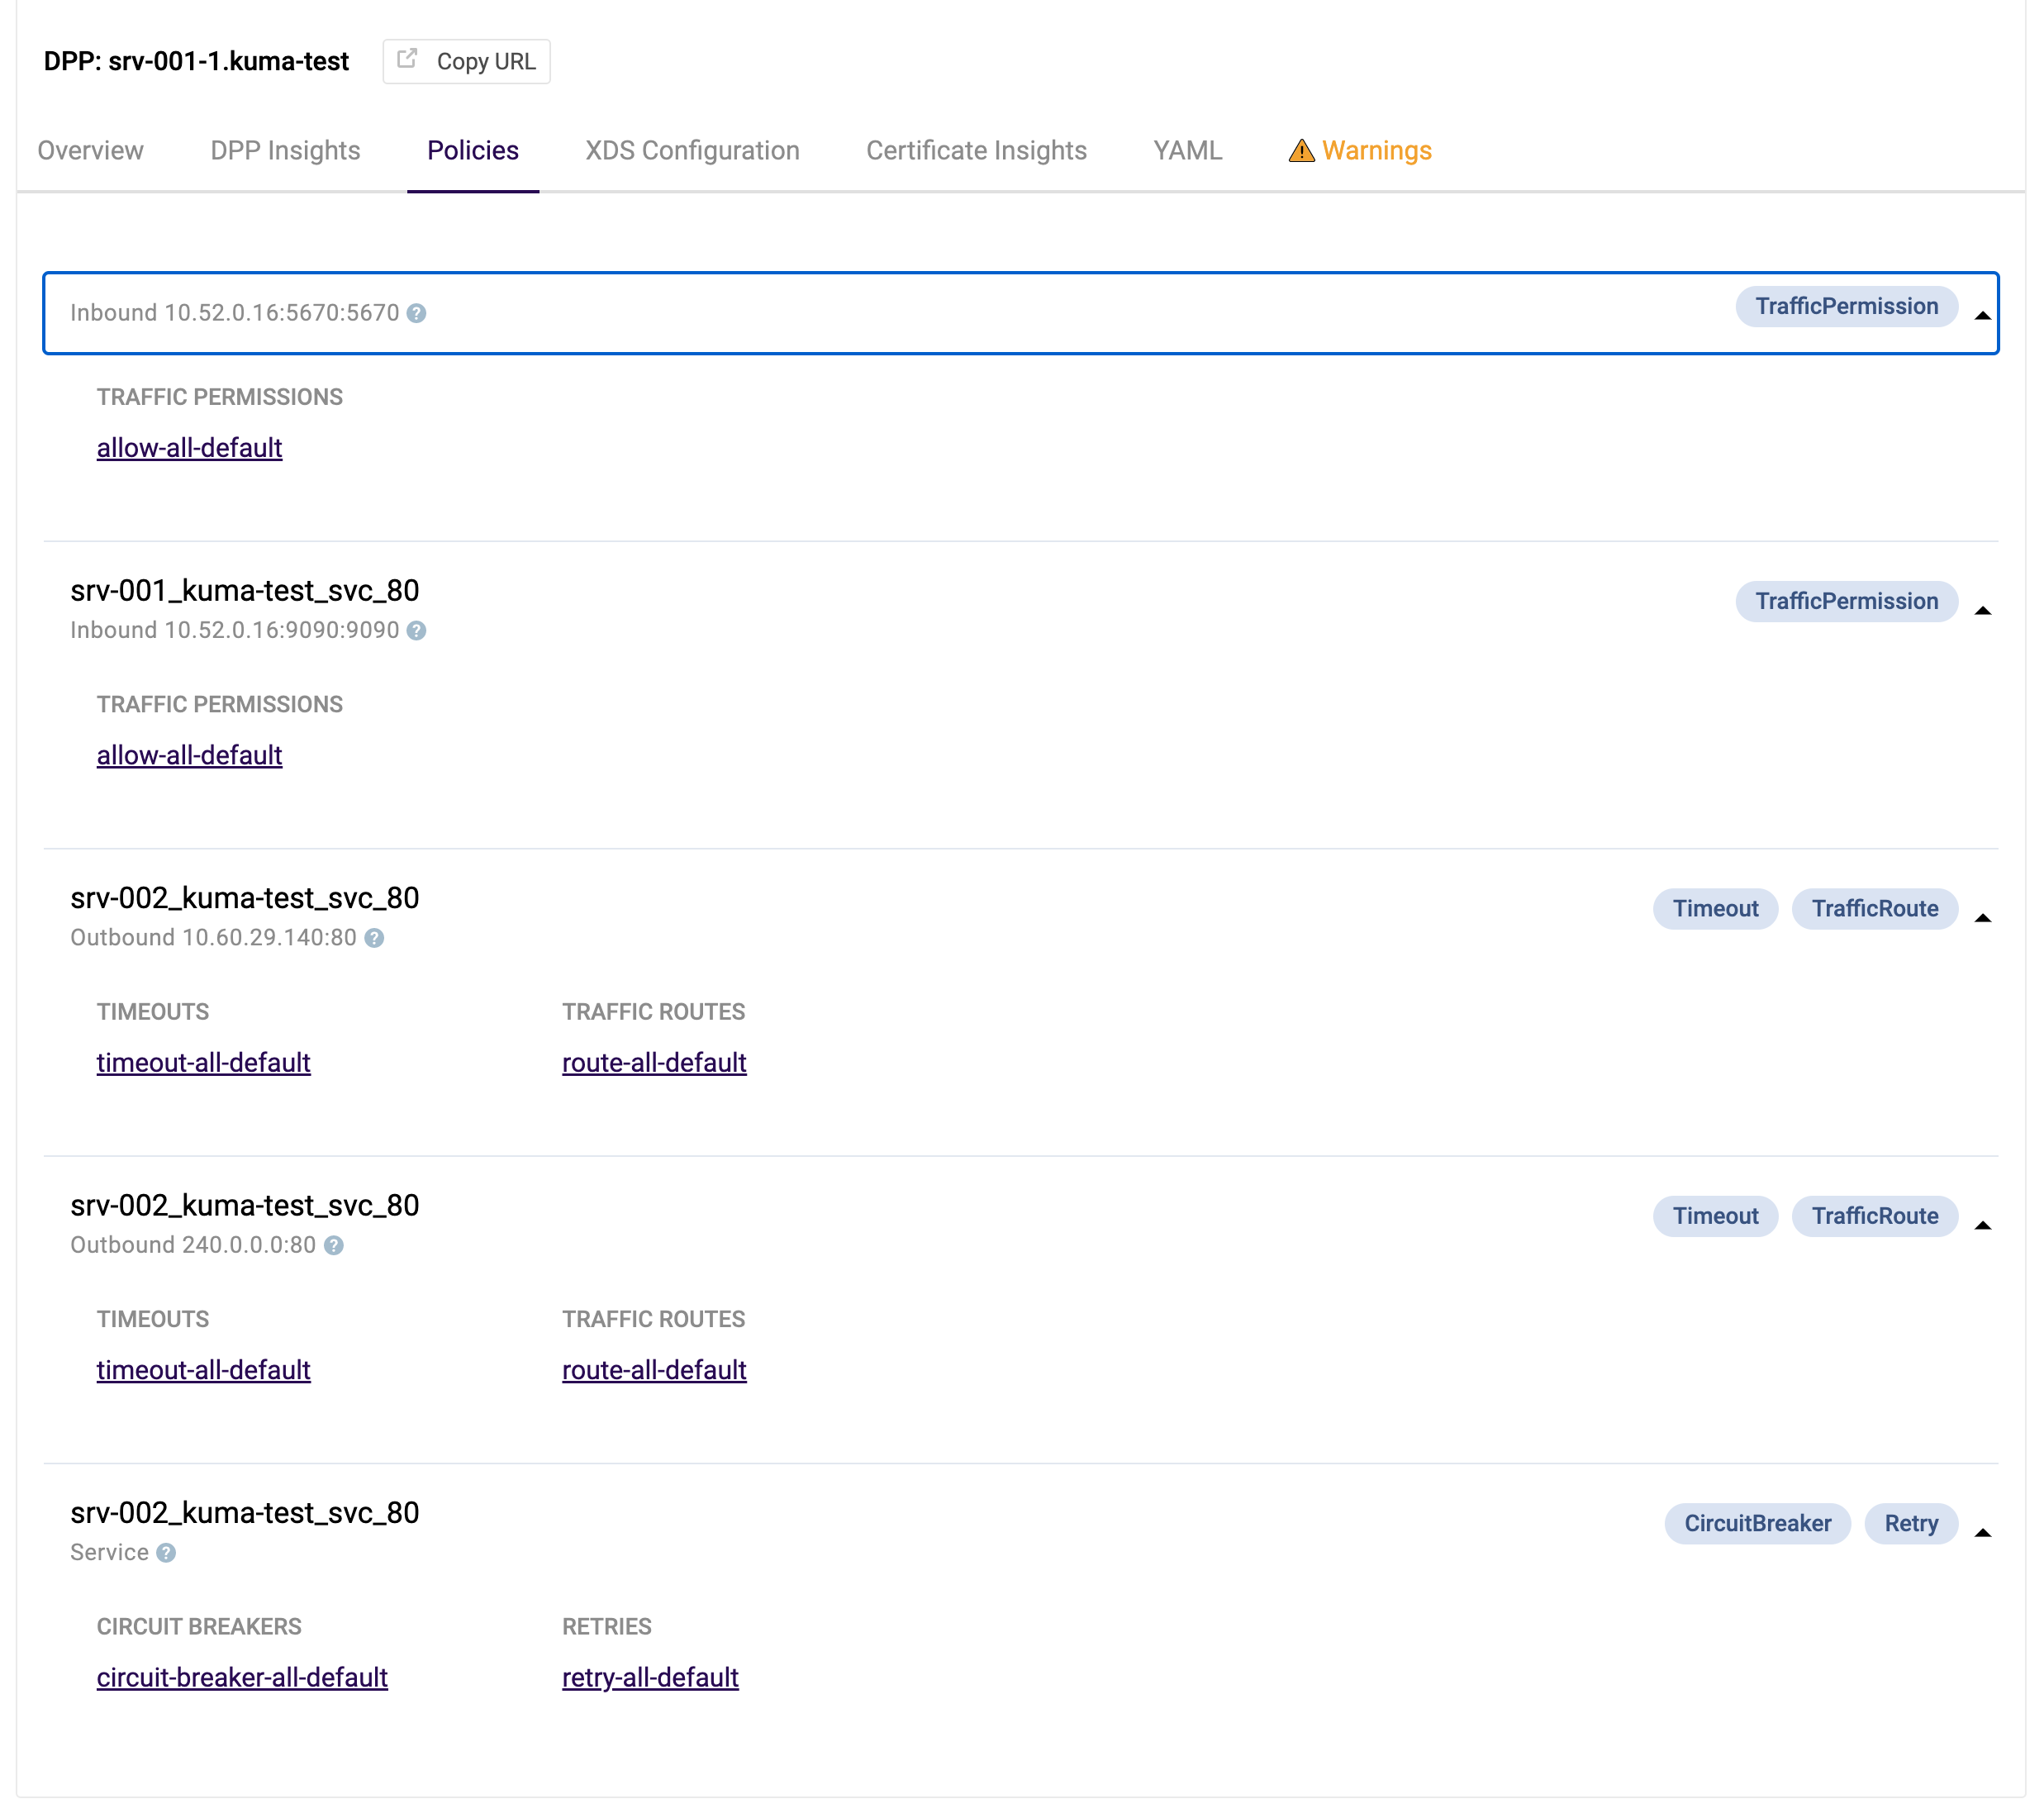
The dataplane view will enable you to see all policies that affect a specific dataplane:
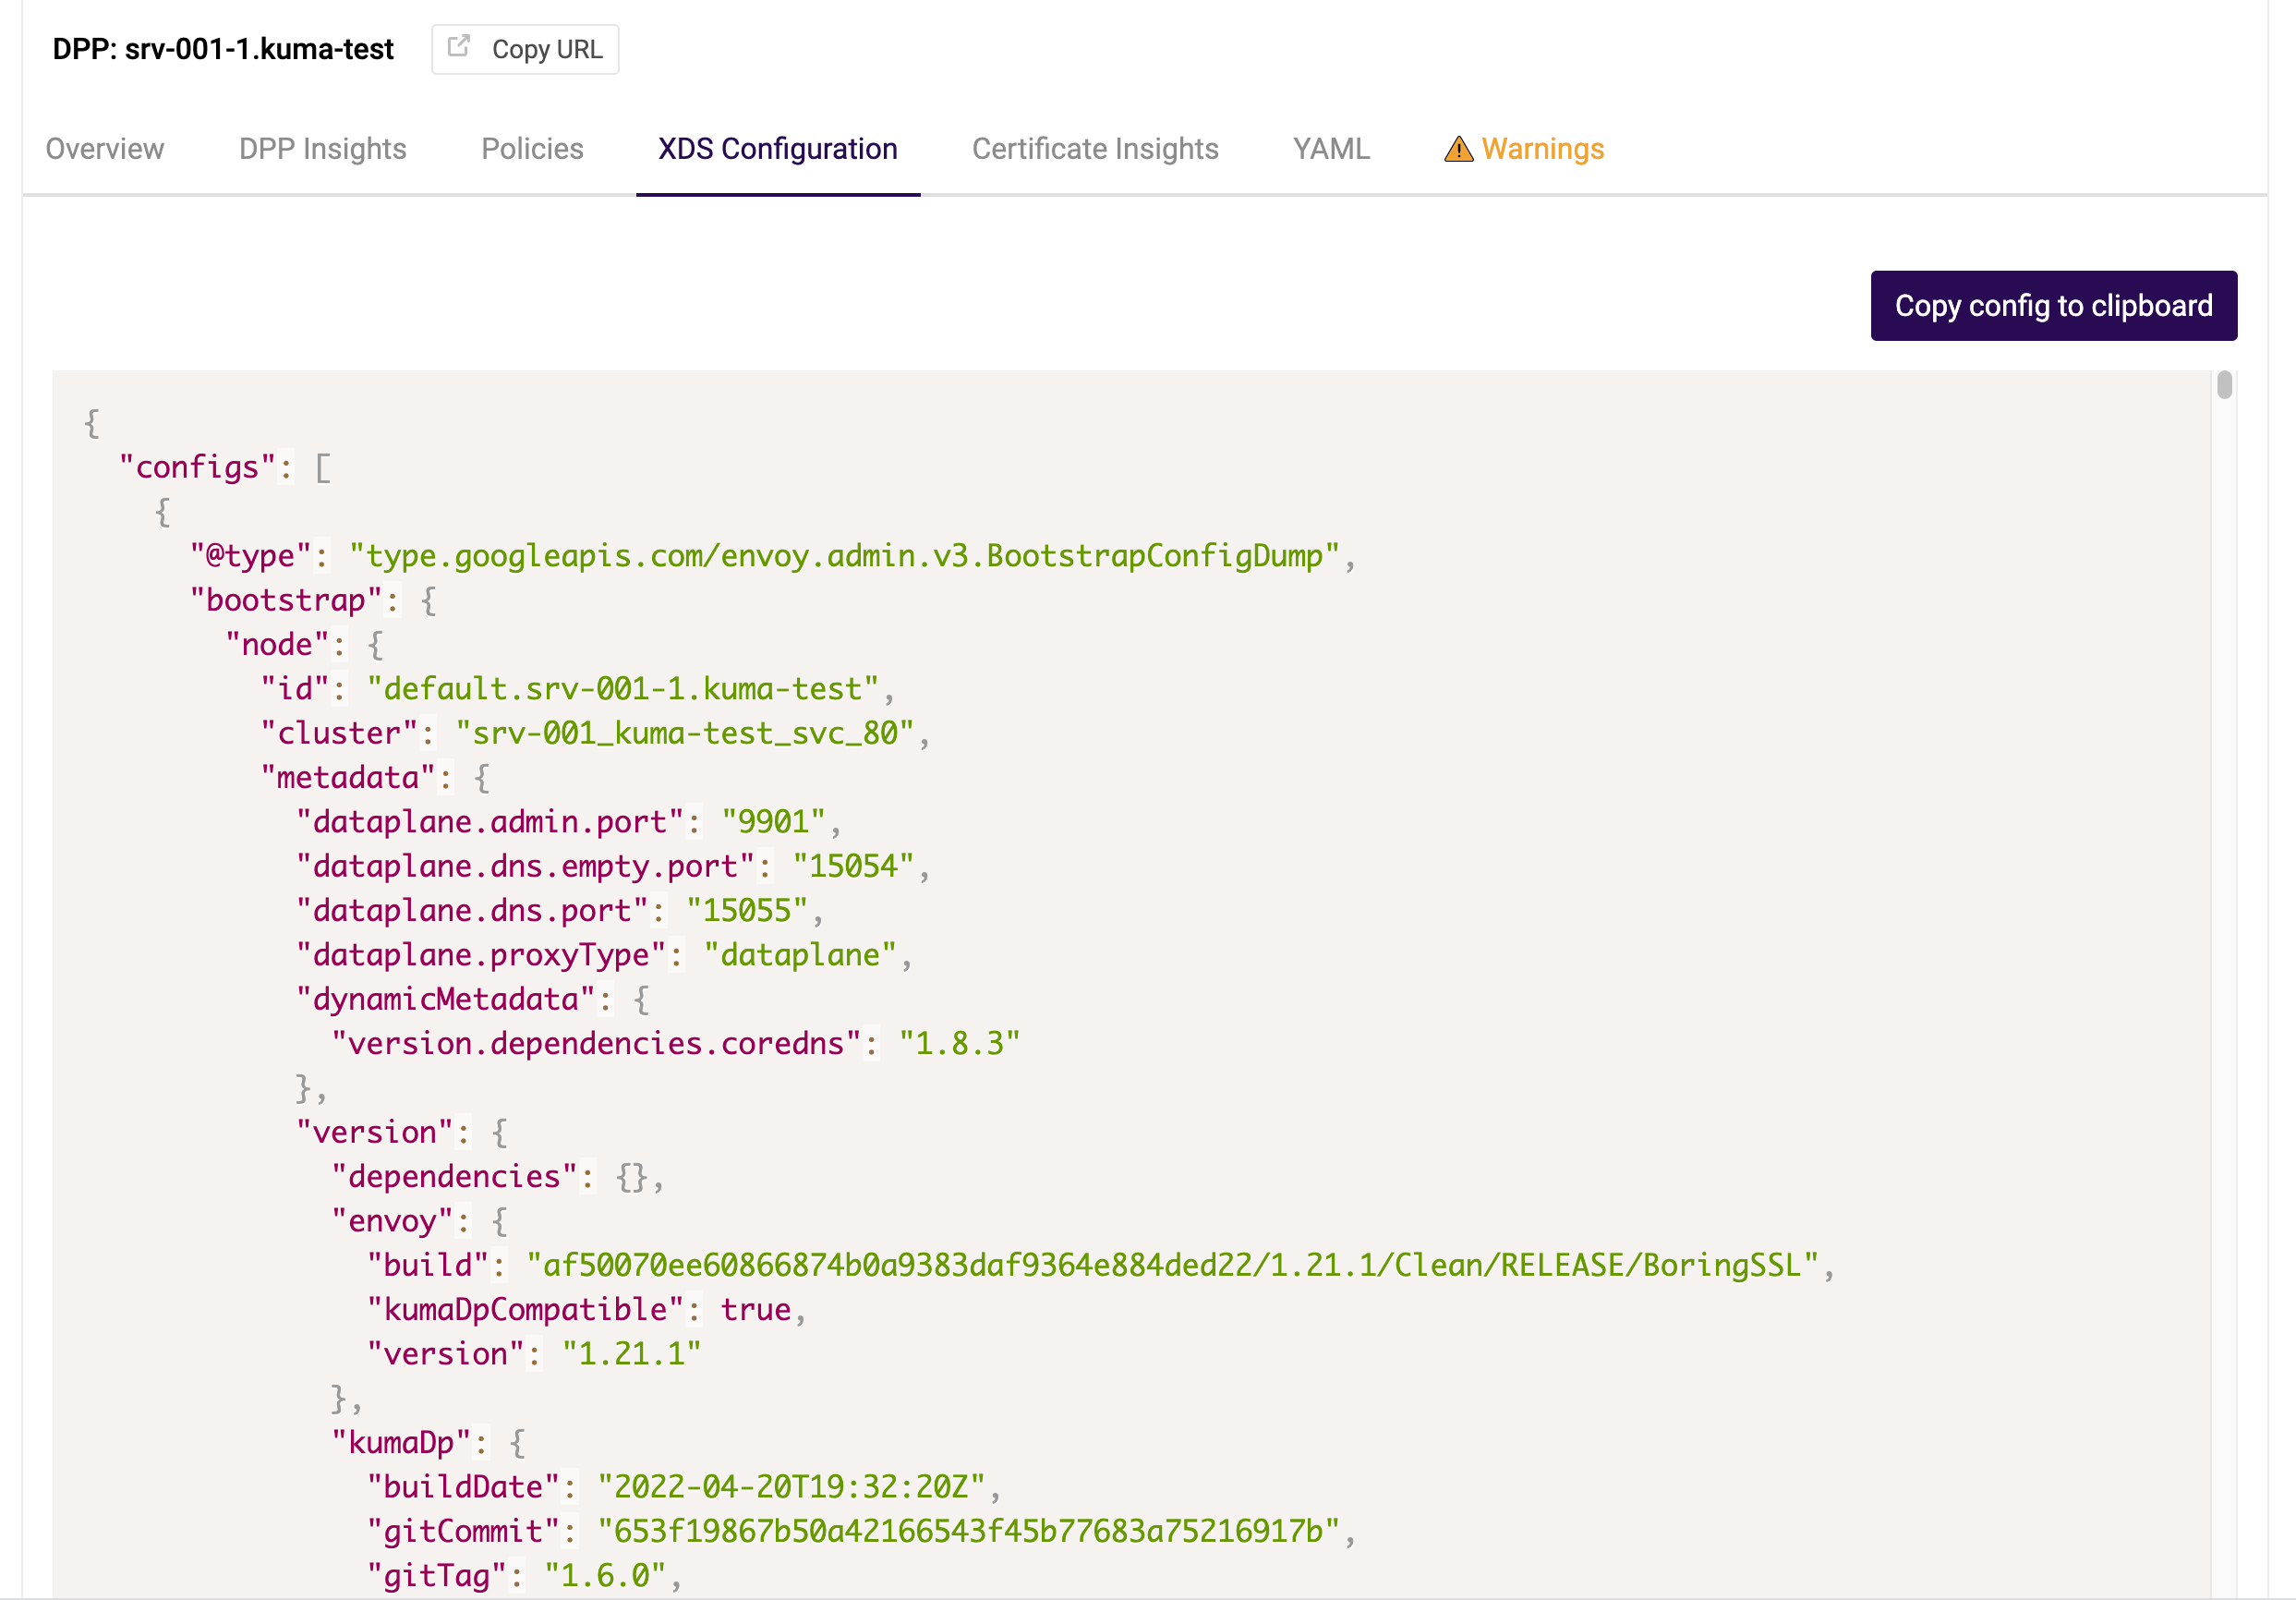
It also gives you access to the full Envoy configuration of each dataplane which is useful when troubleshooting:
What’s to come
The GUI will eventually serve as a hub to view various metrics, such as latency and number of requests (total and per entity). We will also have charts and other visual tools for measuring and monitoring performance.
← CLI Observability →