Careful!
You are browsing documentation for a version of Kuma that is not the latest release.
Traffic Metrics
Kuma facilitates consistent traffic metrics across all data plane proxies in your mesh.
You add metrics to a mesh configuration, or to an individual Dataplane configuration if you need, for example, to override the default metrics port that’s already in use on the specified machine.
Kuma provides full integration with Prometheus:
- Each proxy can expose its metrics in
Prometheusformat. - Because metrics are part of the mesh configuration, Prometheus can automatically find every proxy in the mesh.
To collect metrics from Kuma, you need to first expose metrics from proxies and then configure Prometheus to collect them.
Expose metrics from data plane proxies
To expose metrics from every proxy in the mesh, configure the Mesh resource:
apiVersion: kuma.io/v1alpha1
kind: Mesh
metadata:
  name: default
spec:
  metrics:
    enabledBackend: prometheus-1
    backends:
    - name: prometheus-1
      type: prometheus
which is a convenient shortcut for
apiVersion: kuma.io/v1alpha1
kind: Mesh
metadata:
  name: default
spec:
  metrics:
    enabledBackend: prometheus-1
    backends:
    - name: prometheus-1
      type: prometheus
      conf:
        skipMTLS: false
        port: 5670
        path: /metrics
        tags: # tags that can be referred in Traffic Permission when metrics are secured by mTLS
          kuma.io/service: dataplane-metrics
This tells Kuma to configure every proxy in the default mesh to expose an HTTP endpoint with Prometheus metrics on port 5670 and URI path /metrics.
The metrics endpoint is forwarded to the standard Envoy Prometheus metrics endpoint and supports the same query parameters.
You can pass the filter query parameter to limit the results to metrics whose names match a given regular expression.
By default all available metrics are returned.
Override Prometheus settings per data plane proxy
To override Mesh-wide defaults for a particular Pod, use Kuma-specific annotations:
prometheus.metrics.kuma.io/port- to overrideMesh-wide default portprometheus.metrics.kuma.io/path- to overrideMesh-wide default path
For example:
apiVersion: apps/v1
kind: Deployment
metadata:
  namespace: kuma-example
  name: kuma-tcp-echo
spec:
  ...
  template:
    metadata:
      ...
      annotations:
        prometheus.metrics.kuma.io/port: "1234"               # override Mesh-wide default port
        prometheus.metrics.kuma.io/path: "/non-standard-path" # override Mesh-wide default path
    spec:
      containers:
      ...
Proxies for this Pod expose an HTTP endpoint with Prometheus metrics on port 1234 and URI path /non-standard-path.
Configure Prometheus
Although proxy metrics are now exposed, you still need to let Prometheus discover them.
In Prometheus version 2.29 and later, you can add Kuma metrics to your prometheus.yml:
scrape_configs:
    - job_name: 'kuma-dataplanes'
      scrape_interval: "5s"
      kuma_sd_configs:
      - server: "http://kuma-control-plane.kuma-system.svc:5676"
For more information, see the Prometheus documentation.
For earlier versions of Prometheus, Kuma provides the kuma-prometheus-sd tool, which runs alongside your Prometheus instance.
This tool fetches a list of current data plane proxies from the Kuma control plane and saves the list in Prometheus-compatible format
to a file on disk. Prometheus watches for changes to the file and updates its scraping configuration accordingly.
You can run kumactl install metrics | kubectl apply -f - to deploy configured Prometheus with Grafana.
If you’ve already deployed Prometheus, you can use Prometheus federation to bring Kuma metrics to your main Prometheus cluster.
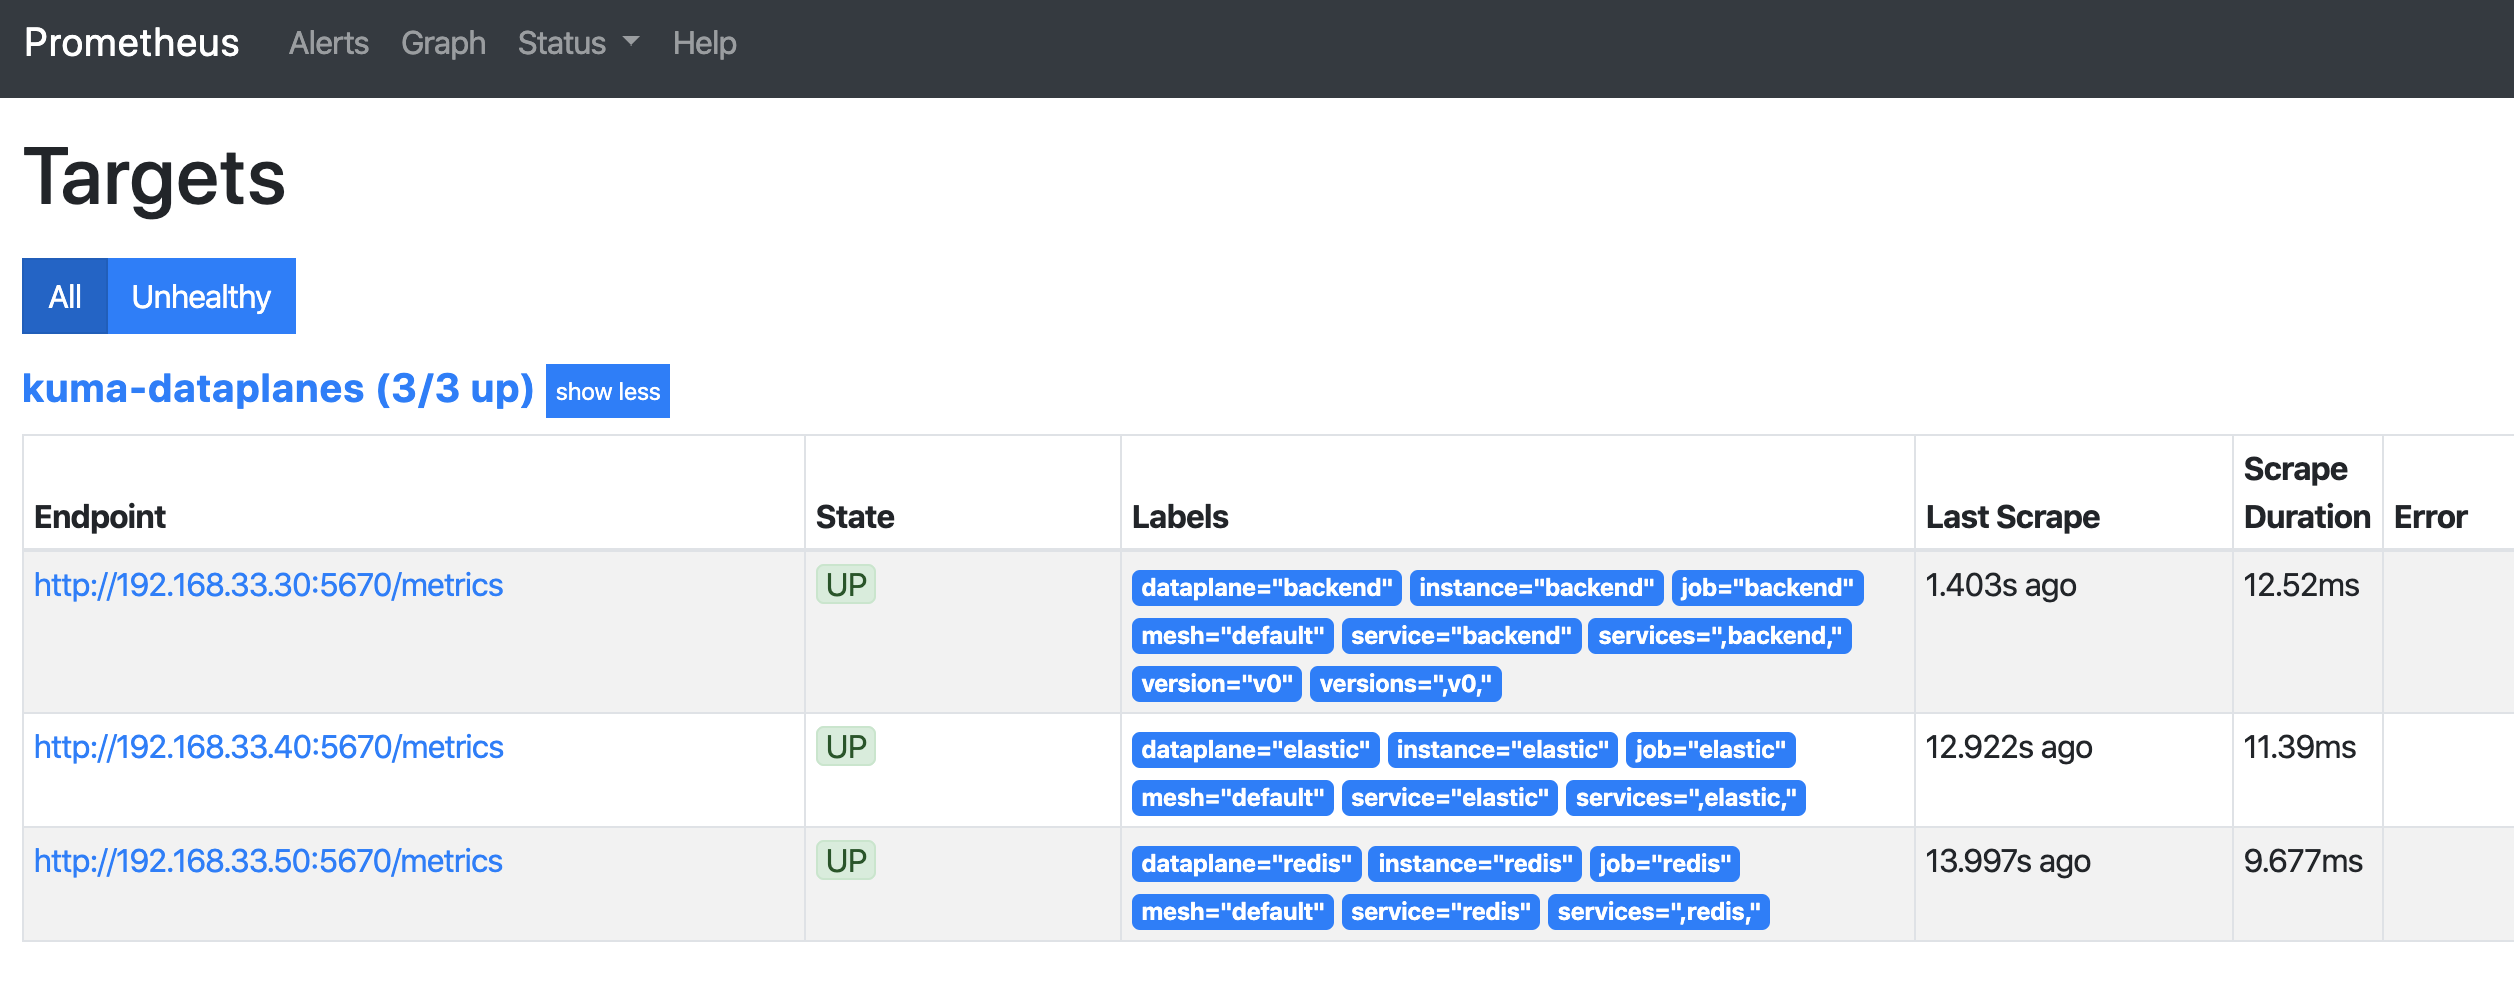
Check the Targets page in the Prometheus dashboard. You should see a list of data plane proxies from your mesh. For example:
Secure data plane proxy metrics
Kuma lets you expose proxy metrics in a secure way by leveraging mTLS. Prometheus needs to be a part of the mesh for this feature to work, which is the default deployment model when kumactl install metrics is used on Kubernetes.
Make sure that mTLS is enabled in the mesh.
apiVersion: kuma.io/v1alpha1
kind: Mesh
metadata:
  name: default
spec:
  mtls:
    enabledBackend: ca-1
    backends:
    - name: ca-1
      type: builtin
  metrics:
    enabledBackend: prometheus-1
    backends:
    - name: prometheus-1
      type: prometheus
      conf:
        port: 5670
        path: /metrics
        skipMTLS: false
        tags: # tags that can be referred in Traffic Permission
          kuma.io/service: dataplane-metrics
Allow the traffic from Grafana to Prometheus Server and from Prometheus Server to data plane proxy metrics and for other Prometheus components:
apiVersion: kuma.io/v1alpha1
kind: TrafficPermission
mesh: default
metadata:
  name: metrics-permissions
spec:
  sources:
    - match:
       kuma.io/service: prometheus-server_kuma-metrics_svc_80
  destinations:
    - match:
       kuma.io/service: dataplane-metrics
    - match:
       kuma.io/service: "prometheus-alertmanager_kuma-metrics_svc_80"
    - match:
       kuma.io/service: "prometheus-kube-state-metrics_kuma-metrics_svc_80"
    - match:
       kuma.io/service: "prometheus-kube-state-metrics_kuma-metrics_svc_81"
    - match:
       kuma.io/service: "prometheus-pushgateway_kuma-metrics_svc_9091"
---
apiVersion: kuma.io/v1alpha1
kind: TrafficPermission
mesh: default
metadata:
  name: grafana-to-prometheus
spec:
   sources:
   - match:
      kuma.io/service: "grafana_kuma-metrics_svc_80"
   destinations:
   - match:
      kuma.io/service: "prometheus-server_kuma-metrics_svc_80"
Expose metrics from applications
In addition to exposing metrics from the data plane proxies, you might want to expose metrics from applications running next to the proxies.
Use standard prometheus.io annotations on Pod or Service:
apiVersion: apps/v1
kind: Deployment
metadata:
  namespace: kuma-example
  name: kuma-tcp-echo
spec:
  ...
  template:
    metadata:
      ...
      annotations:
        prometheus.io/scrape: "true"
        prometheus.io/port: "1234"
        prometheus.io/path: "/non-standard-path"
    spec:
      containers:
      ...
To consume paths protected by mTLS, you need Traffic Permission that lets Prometheus consume applications.
Grafana Dashboards
Kuma ships with four default dashboards that are available to import from the Grafana Labs repository.
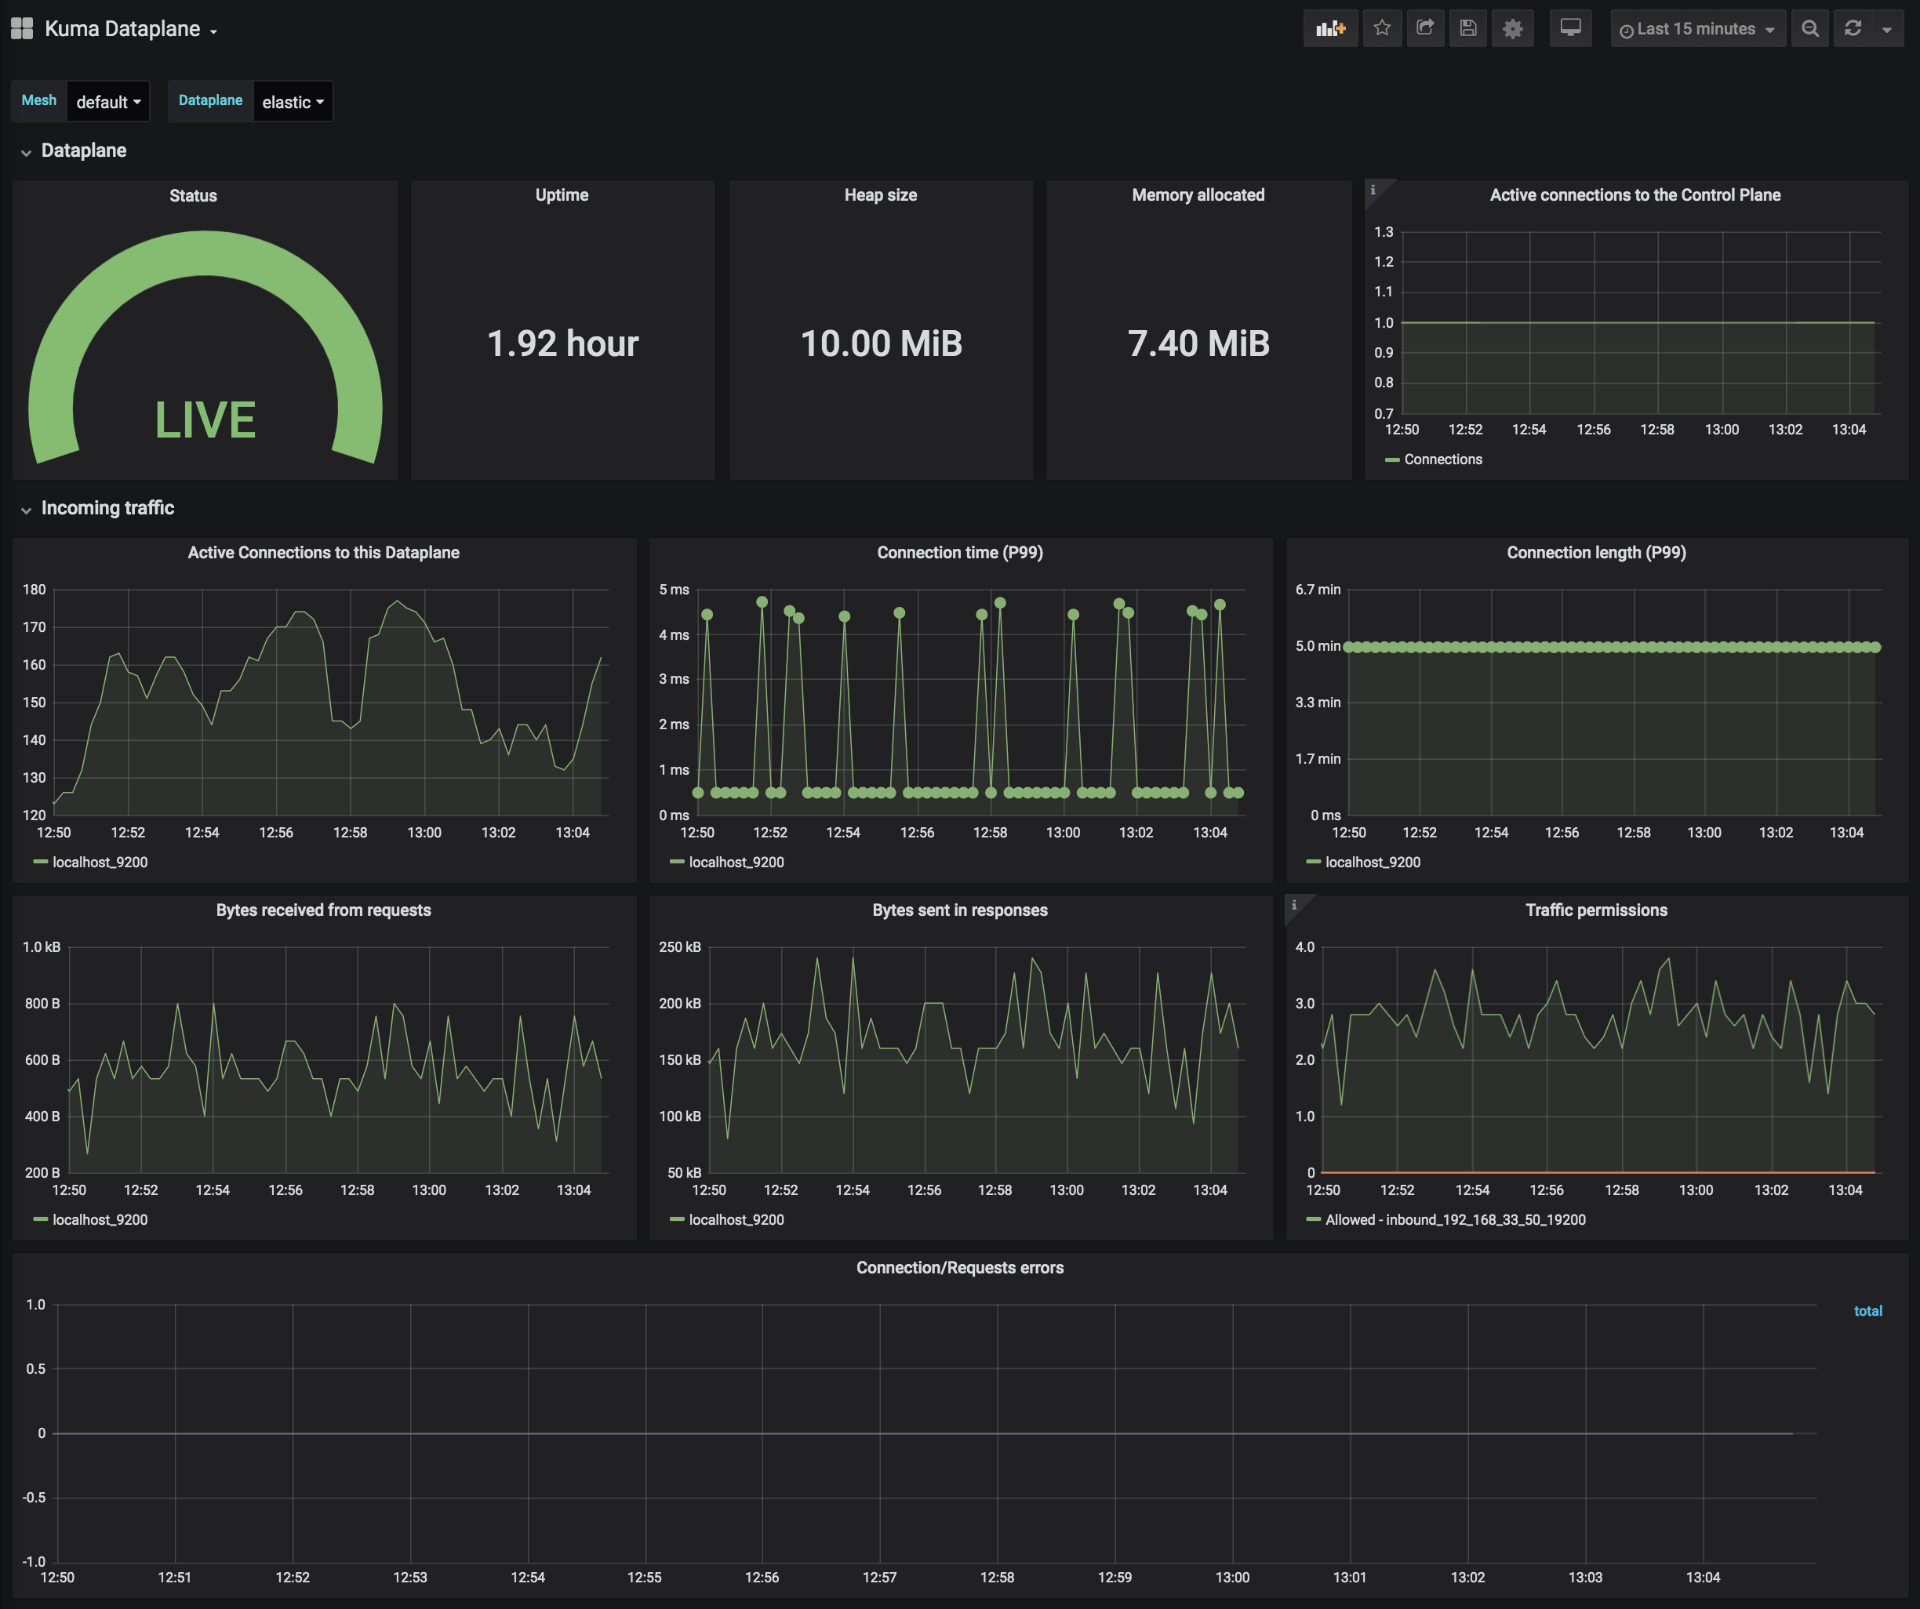
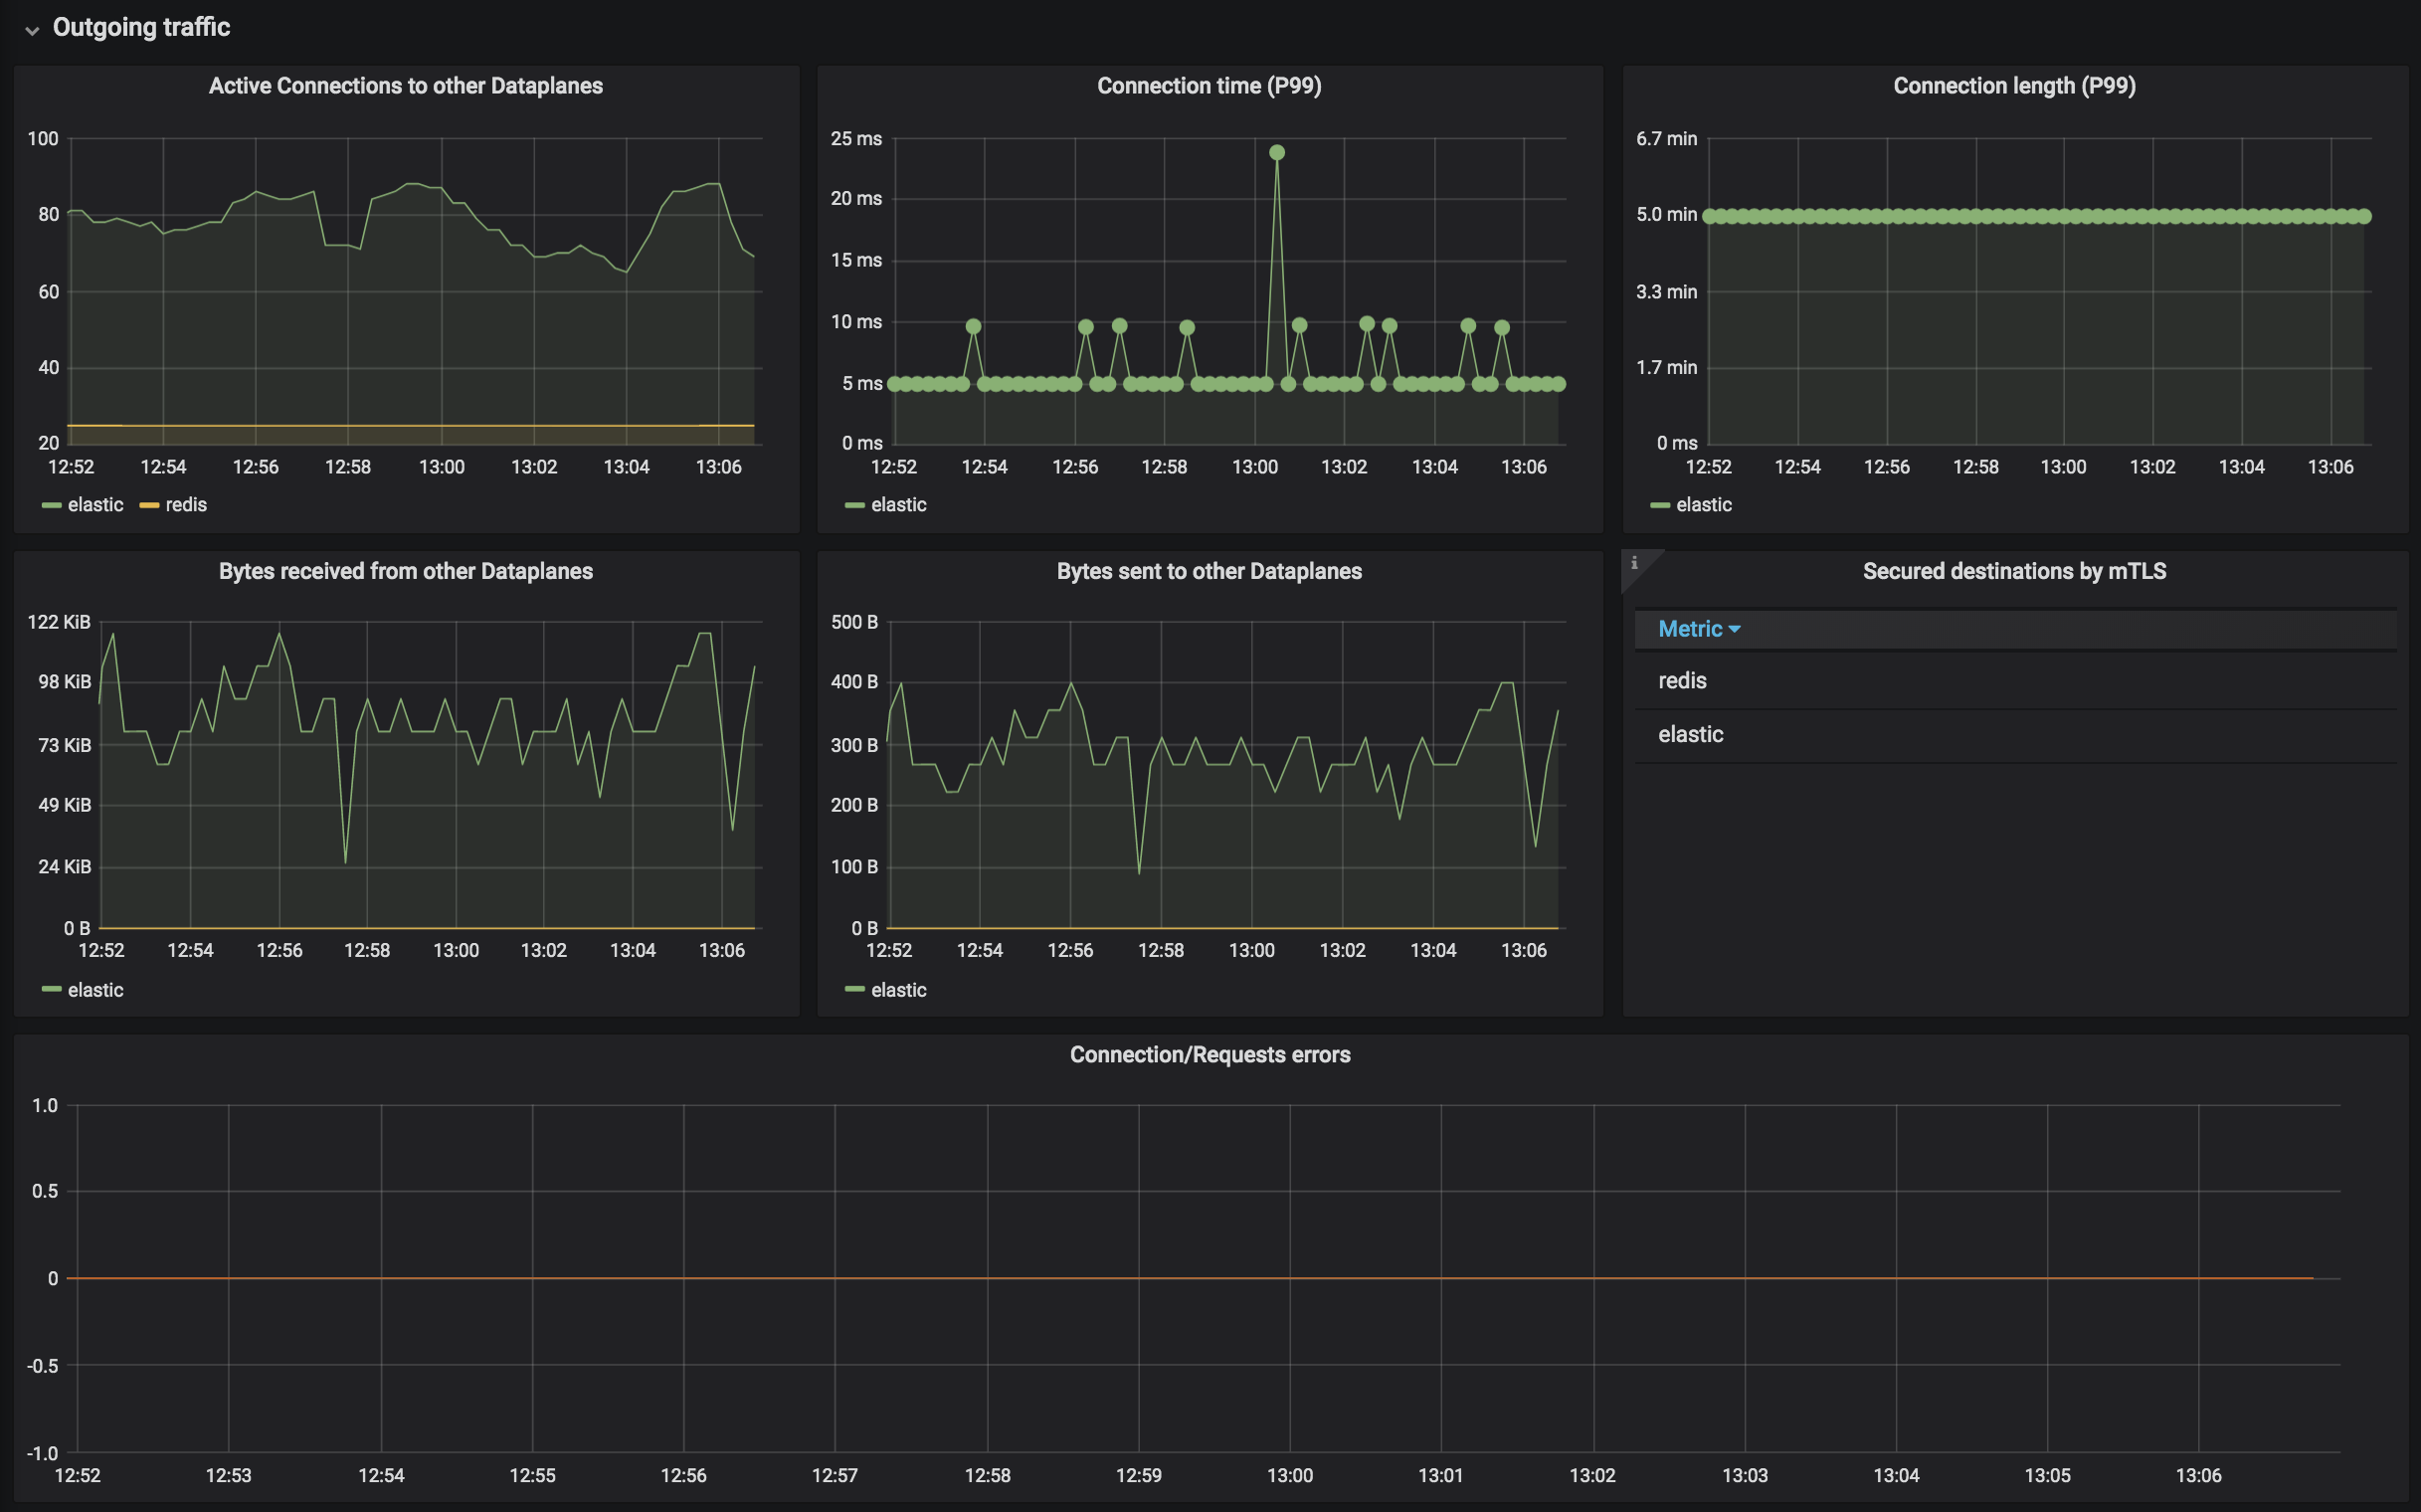
Kuma Dataplane
This dashboards lets you investigate the status of a single dataplane in the mesh.
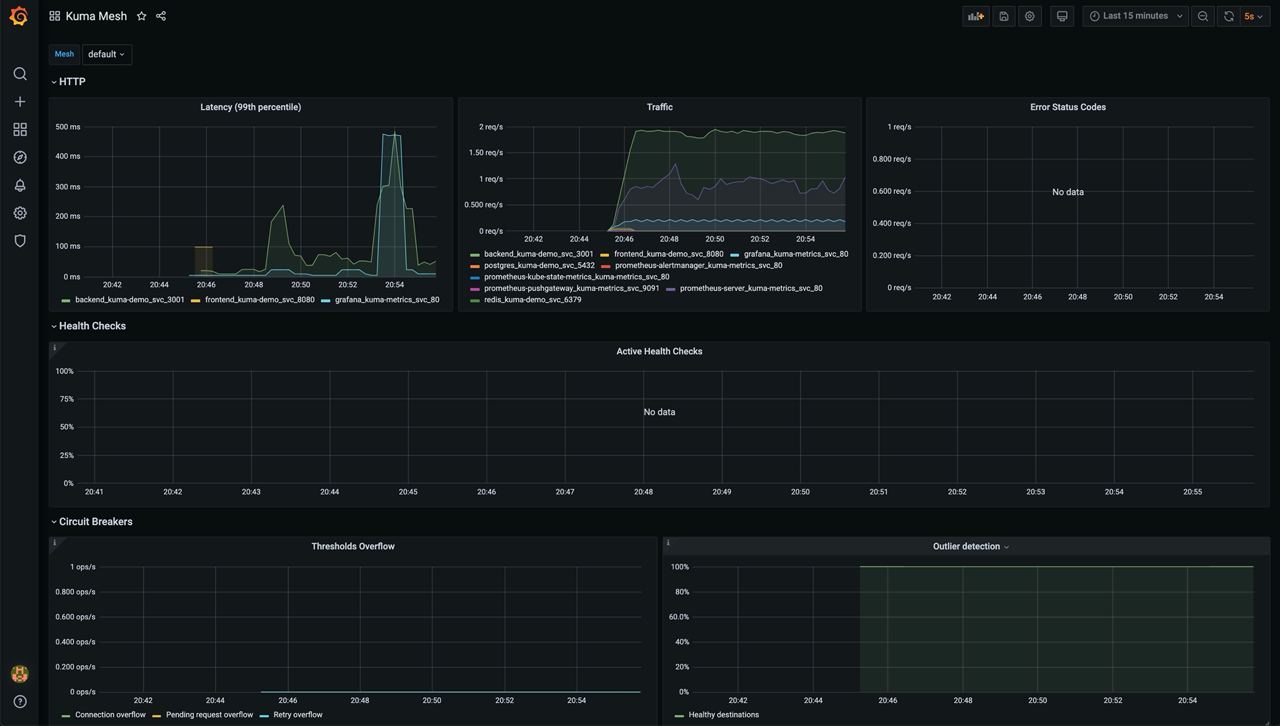
Kuma Mesh
This dashboard lets you investigate the aggregated statistics of a single mesh.
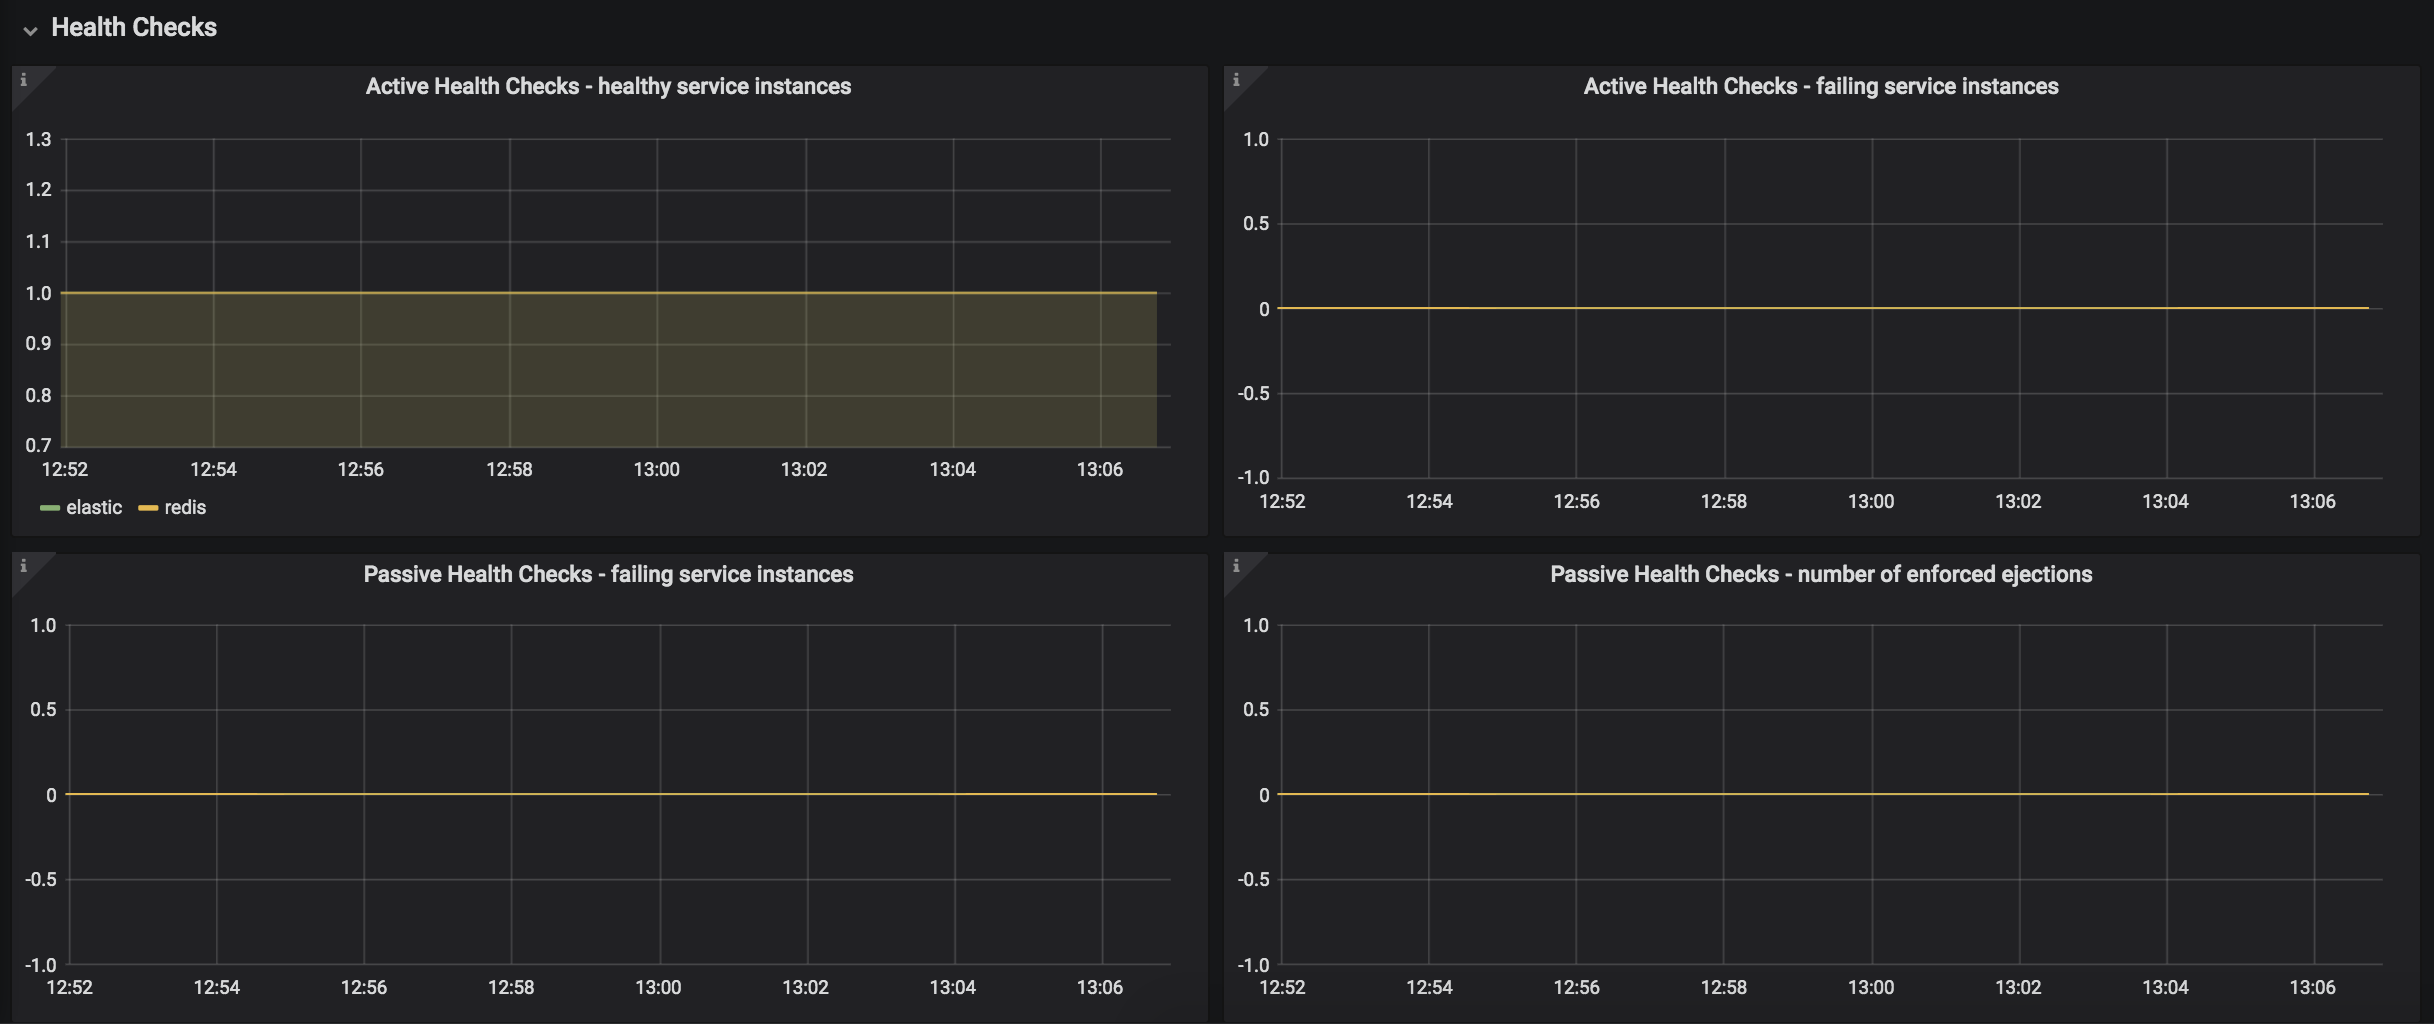
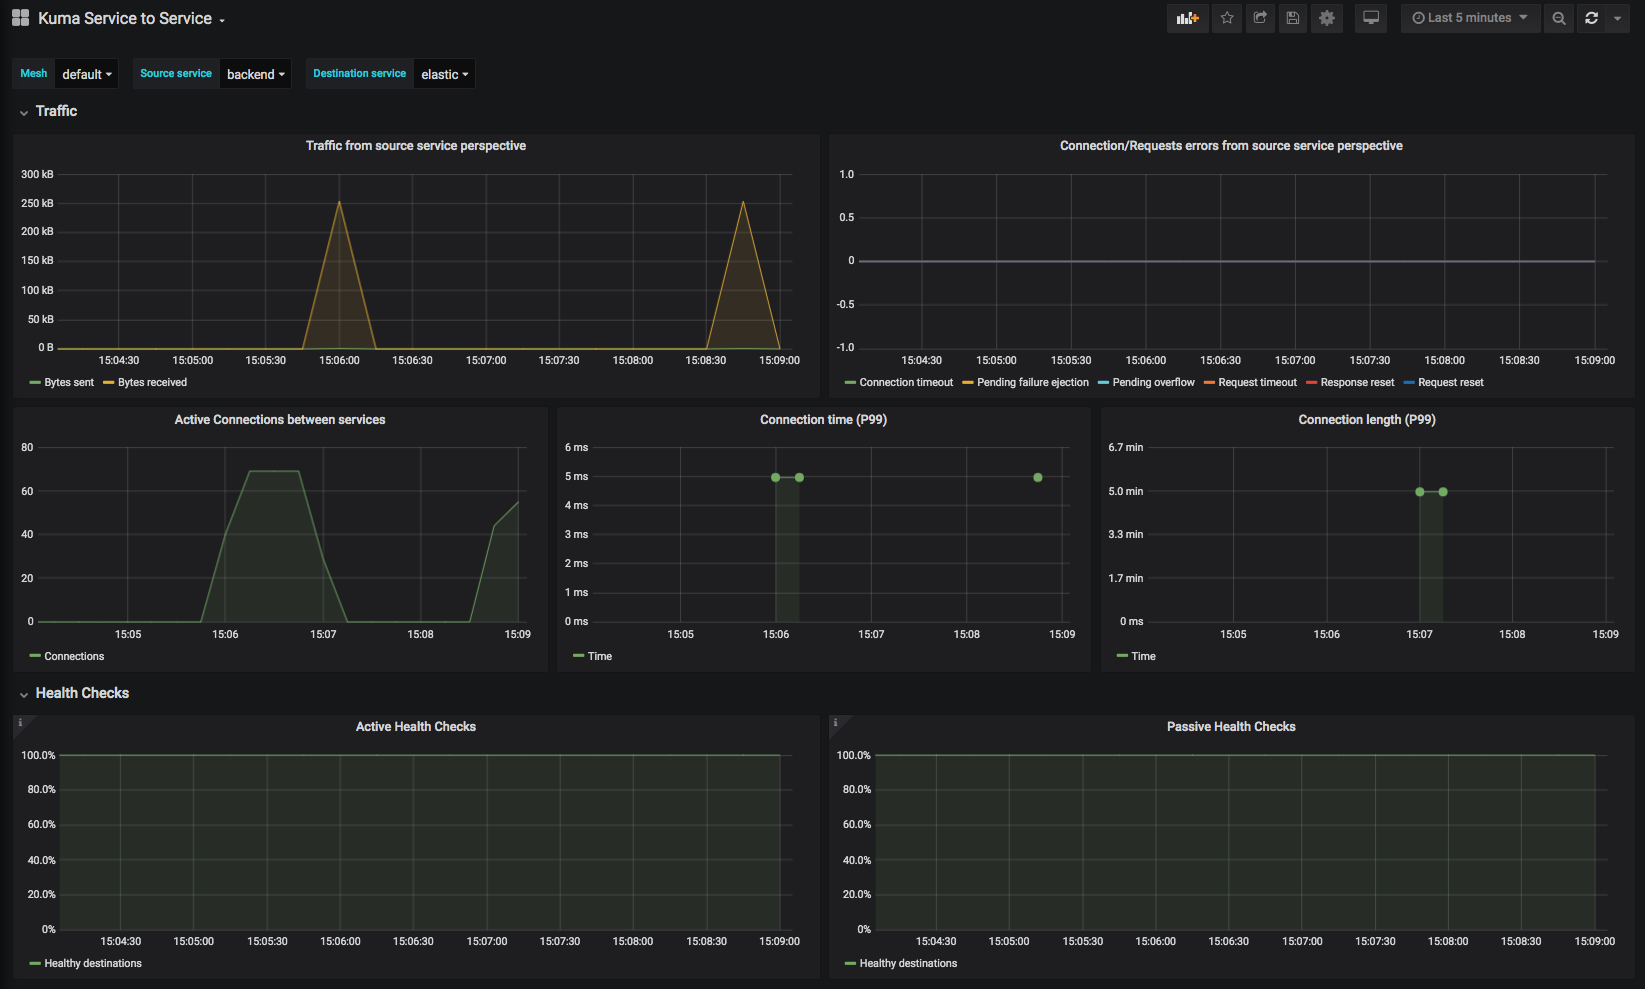
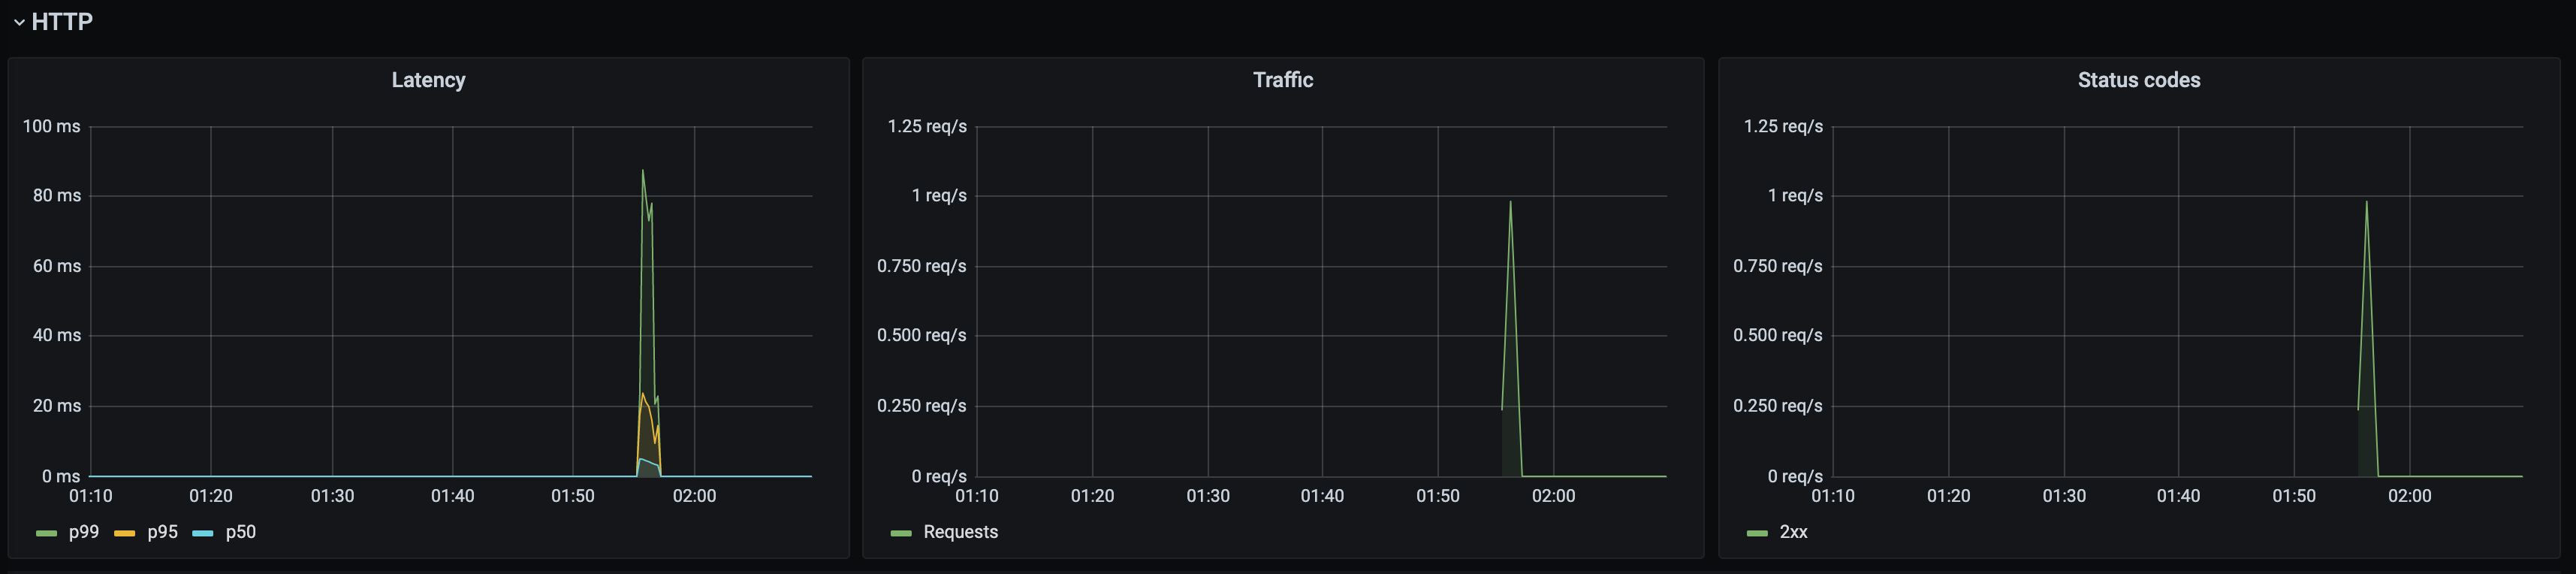
Kuma Service to Service
This dashboard lets you investigate aggregated statistics from dataplanes of given source service to dataplanes of given destination service.
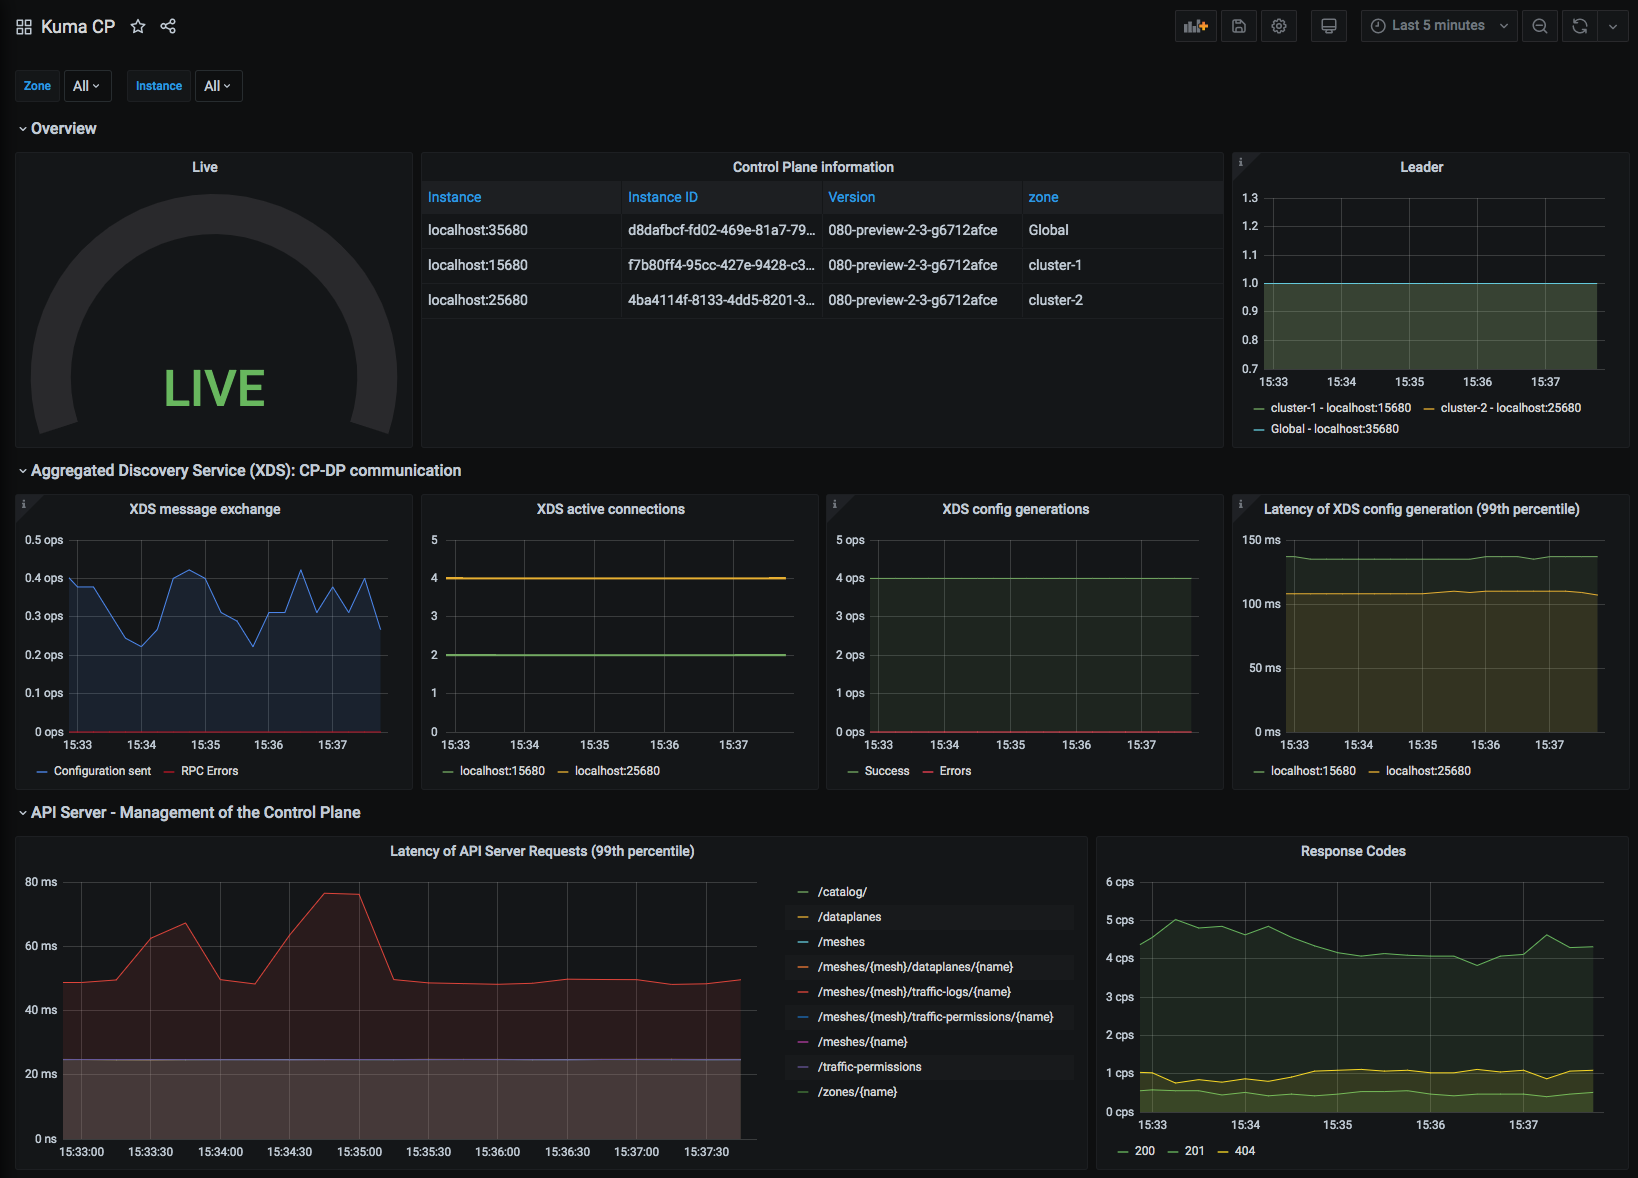
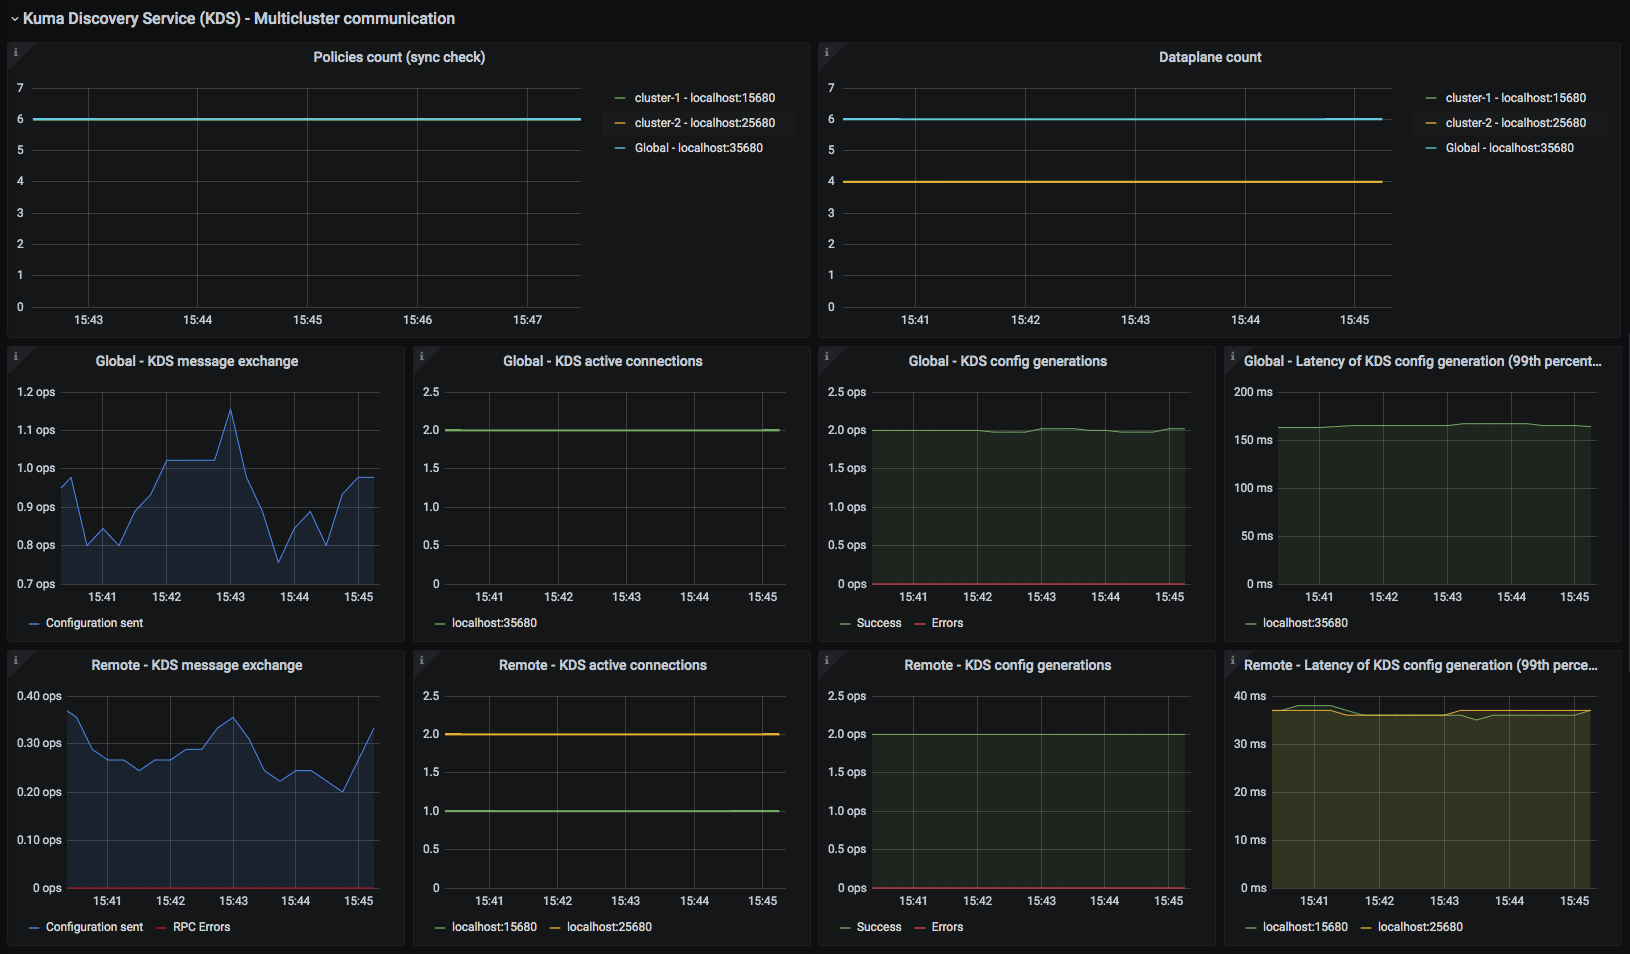
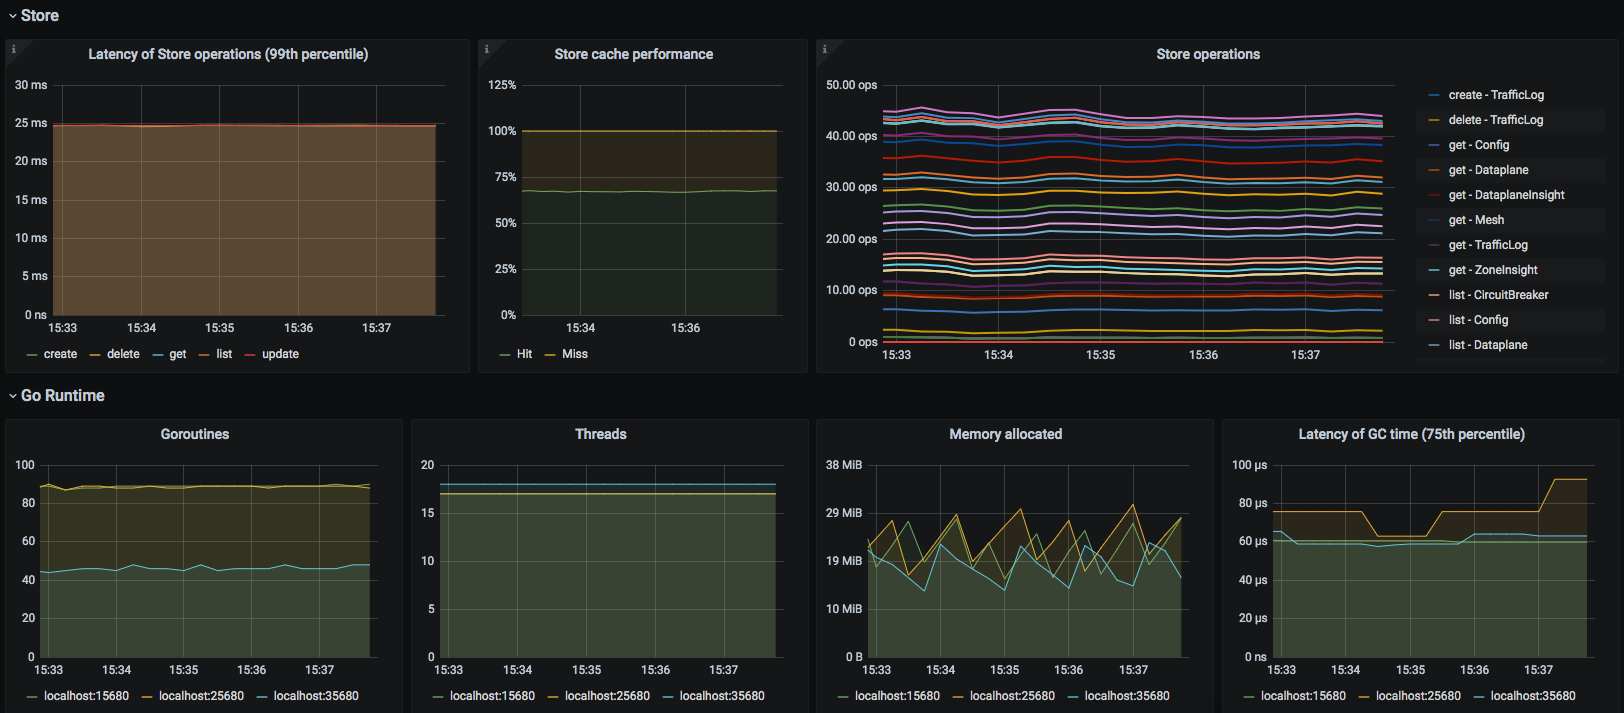
Kuma CP
This dashboard lets you investigate statistics of the control plane.
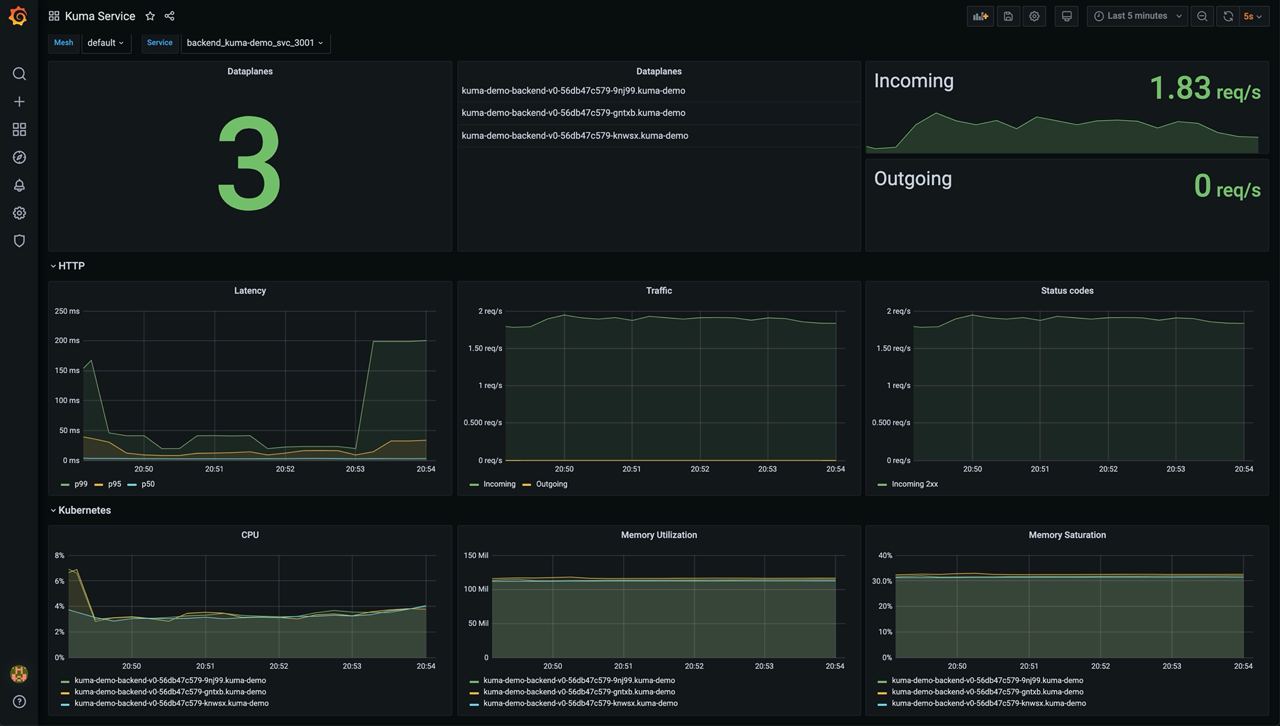
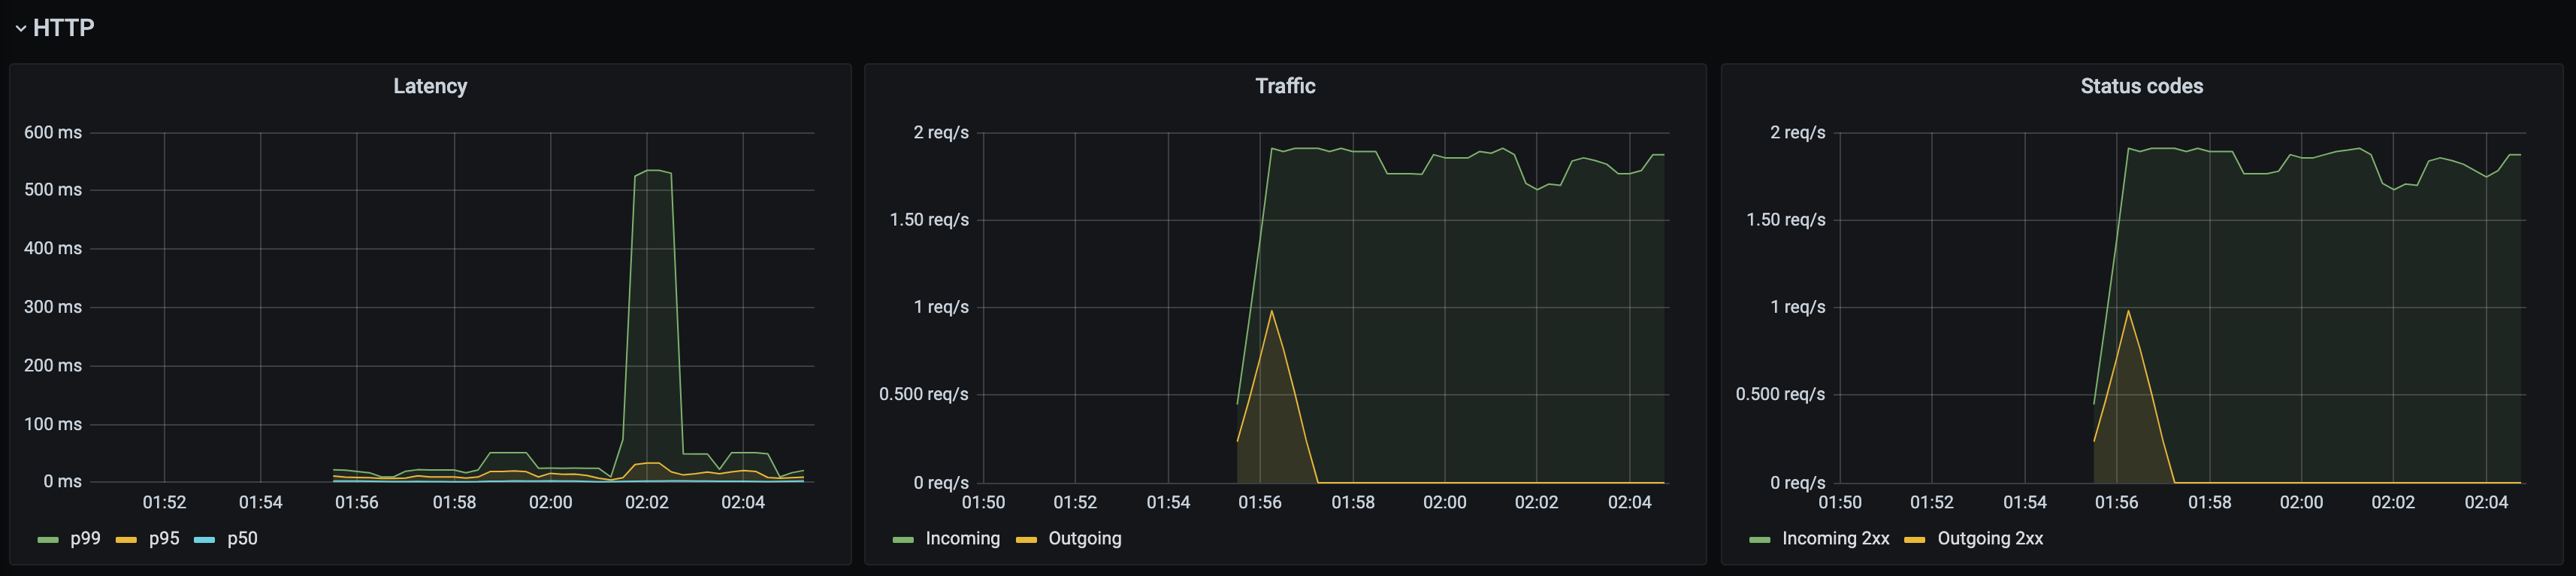
Kuma Service
This dashboard lets you investigate aggregated statistics for each service.