Careful!
You are browsing documentation for a version of Kuma that is not the latest release.
Traffic Log
With TrafficLog policy you can easily set up access logs on every data-plane in a Mesh.
Configuring access logs in Kuma is a 3-step process:
- 1. Add a logging backend
- 2. Add a TrafficLog resource
- 3. Log aggregation and visualisation (kubernetes only)
Add a logging backend
A logging backend is essentially a sink for access logs.
In the current release of Kuma, a logging backend can be either a file or a TCP log collector, such as Logstash.
apiVersion: kuma.io/v1alpha1
kind: Mesh
metadata:
  name: default
spec:
  logging:
    # TrafficLog policies may leave the `backend` field undefined.
    # In that case the logs will be forwarded into the `defaultBackend` of that Mesh.
    defaultBackend: file
    # List of logging backends that can be referred to by name
    # from TrafficLog policies of that Mesh.
    backends:
      - name: logstash
        # Use `format` field to adjust the access log format to your use case.
        format: '{"start_time": "%START_TIME%", "source": "%KUMA_SOURCE_SERVICE%", "destination": "%KUMA_DESTINATION_SERVICE%", "source_address": "%KUMA_SOURCE_ADDRESS_WITHOUT_PORT%", "destination_address": "%UPSTREAM_HOST%", "duration_millis": "%DURATION%", "bytes_received": "%BYTES_RECEIVED%", "bytes_sent": "%BYTES_SENT%"}'
        type: tcp
        # Use `config` field to co configure a TCP logging backend.
        conf:
          # Address of a log collector.
          address: 127.0.0.1:5000
      - name: file
        type: file
        # Use `file` field to configure a file-based logging backend.
        conf:
          path: /tmp/access.log
        # When `format` field is omitted, the default access log format will be used.
Add a TrafficLog resource
You need to create a TrafficLog policy to select a subset of traffic and forward its access logs into one of the logging backends configured for that Mesh.
When backend field of a TrafficLog policy is omitted, the logs will be forwarded into the defaultBackend of that Mesh.
Log aggregation and visualisation
Kuma is presenting a simple solution to aggregate the logs of your containers and the access logs of your data-planes.
1. Install Loki
To install Loki use kumactl install logging | kubectl apply -f -. This will deploy Loki automatically in a kuma-logging namespace.
2. Update the mesh
The logging backend needs to be configured to send the access logs of your data-planes to stdout.
Loki will directly retrieve the logs from stdout of your containers.
type: Mesh
metadata:
  name: default
spec:
    logging:
      defaultBackend: loki
      backends:
        - name: loki
          type: file
          conf:
            path: /dev/stdout
3. Configure Grafana to visualize the logs
To visualise your containers’ logs and your access logs you need to have a Grafana up and running. You can install Grafana by following the information of the official page or use the one installed with Traffic metrics.
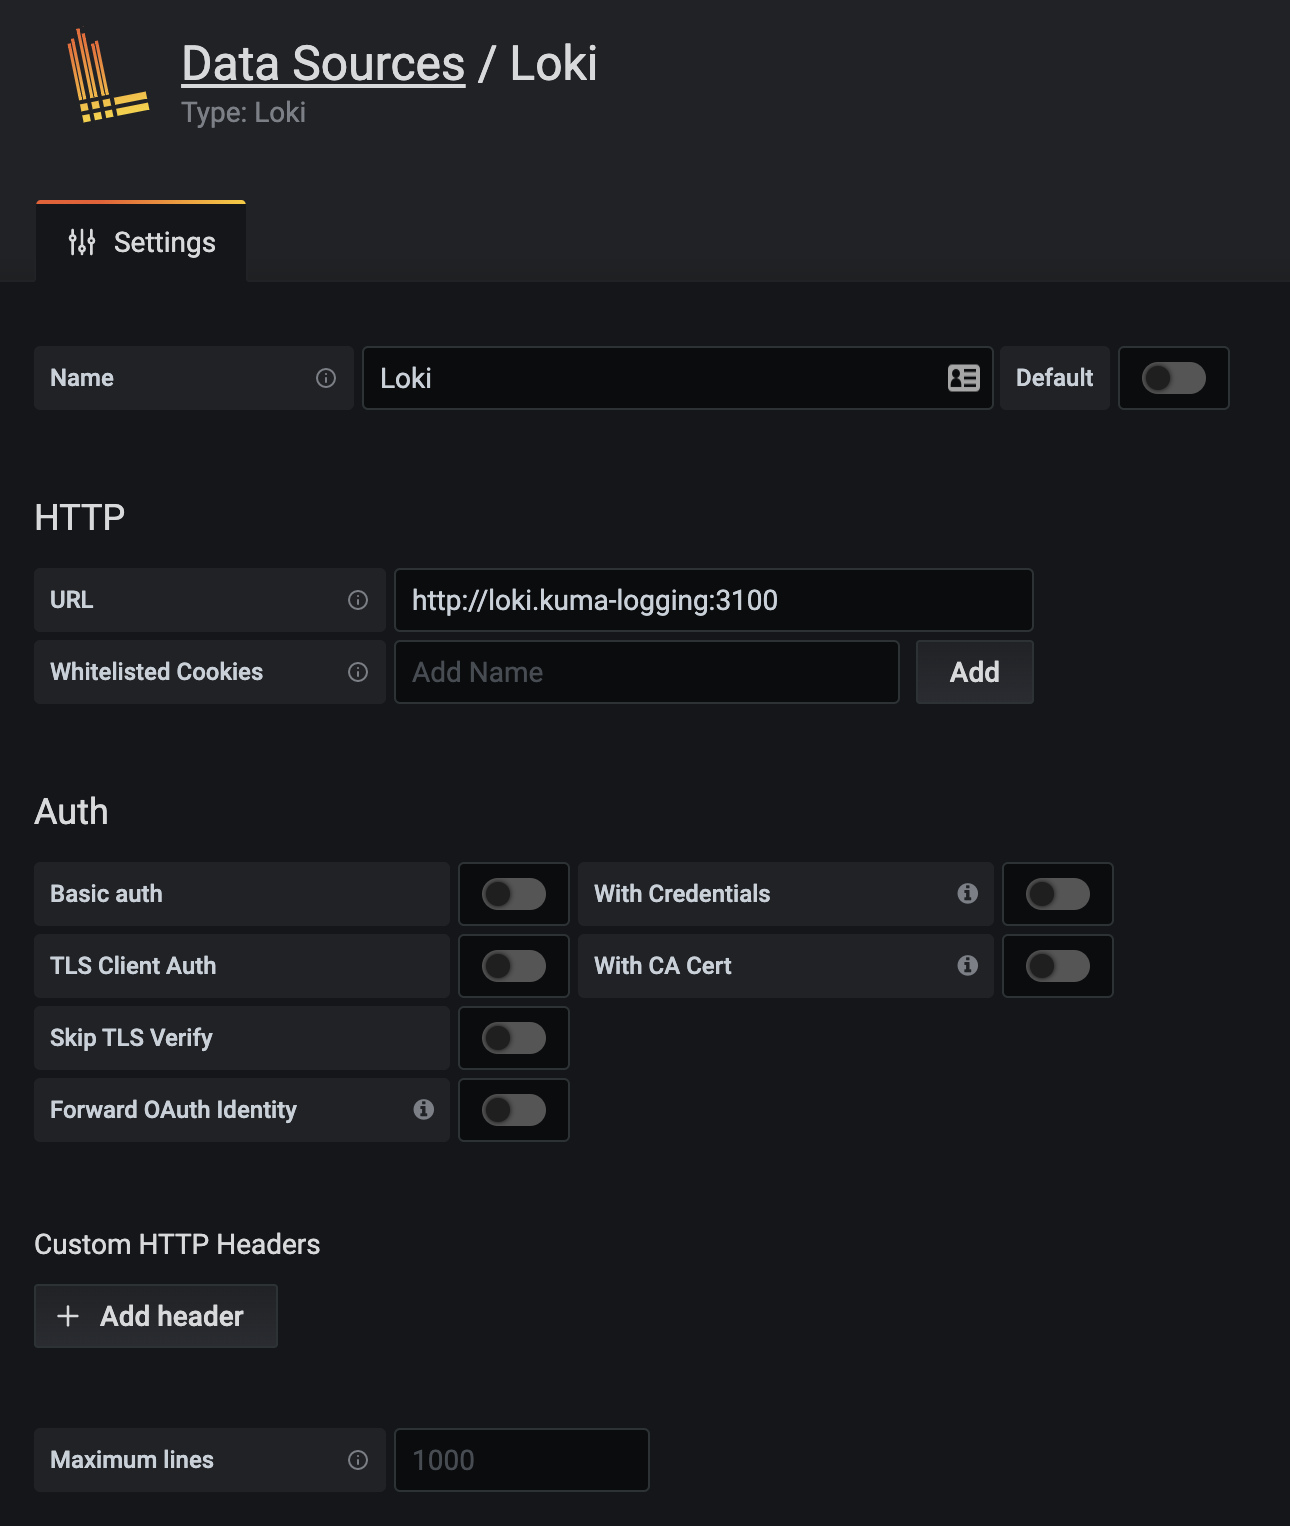
With Grafana installed you can configure a new datasource with url:http://loki.kuma-logging:3100 so Grafana will be able to retrieve the logs from Loki.

At this point you can visualize your containers’ logs and your access logs in Grafana by choosing the loki datasource in the explore section.
Nice to have
Having your Logs and Traces in the same visualisation tool can come really handy. By adding the traceId in your app logs you can visualize your logs and the related Jaeger traces. To learn more about it go read this article.
To set up tracing see the traffic-trace policy.
You can also forward the access logs to a collector (such as logstash) that can further transmit them into systems like Splunk, ELK and Datadog.
Access Log Format
Kuma gives you full control over the format of access logs.
The shape of a single log record is defined by a template string that uses command operators to extract and format data about a TCP connection or an HTTP request.
E.g.,
%START_TIME% %KUMA_SOURCE_SERVICE% => %KUMA_DESTINATION_SERVICE% %DURATION%
where %START_TIME% and %KUMA_SOURCE_SERVICE% are examples of available command operators.
A complete set of supported command operators consists of:
- All command operators supported by Envoy
- Command operators unique to Kuma
The latter include:
| Command Operator | Description |
|---|---|
%KUMA_MESH% |
name of the mesh in which traffic is flowing |
%KUMA_SOURCE_SERVICE% |
name of a service that is the source of traffic |
%KUMA_DESTINATION_SERVICE% |
name of a service that is the destination of traffic |
%KUMA_SOURCE_ADDRESS_WITHOUT_PORT% |
address of a Dataplane that is the source of traffic |
%KUMA_TRAFFIC_DIRECTION% |
direction of the traffic, INBOUND, OUTBOUND or UNSPECIFIED |
Access Logs for TCP and HTTP traffic
All access log command operators are valid to use with both TCP and HTTP traffic.
If a command operator is specific to HTTP traffic, such as %REQ(X?Y):Z% or %RESP(X?Y):Z%, it will be replaced by a symbol “-” in case of TCP traffic.
Internally, Kuma determines traffic protocol based on the value of kuma.io/protocol tag on the inbound interface of a destination Dataplane.
The default format string for TCP traffic is:
[%START_TIME%] %RESPONSE_FLAGS% %KUMA_MESH% %KUMA_SOURCE_ADDRESS_WITHOUT_PORT%(%KUMA_SOURCE_SERVICE%)->%UPSTREAM_HOST%(%KUMA_DESTINATION_SERVICE%) took %DURATION%ms, sent %BYTES_SENT% bytes, received: %BYTES_RECEIVED% bytes
The default format string for HTTP traffic is:
[%START_TIME%] %KUMA_MESH% "%REQ(:METHOD)% %REQ(X-ENVOY-ORIGINAL-PATH?:PATH)% %PROTOCOL%" %RESPONSE_CODE% %RESPONSE_FLAGS% %BYTES_RECEIVED% %BYTES_SENT% %DURATION% %RESP(X-ENVOY-UPSTREAM-SERVICE-TIME)% "%REQ(X-FORWARDED-FOR)%" "%REQ(USER-AGENT)%" "%REQ(X-REQUEST-ID)%" "%REQ(:AUTHORITY)%" "%KUMA_SOURCE_SERVICE%" "%KUMA_DESTINATION_SERVICE%" "%KUMA_SOURCE_ADDRESS_WITHOUT_PORT%" "%UPSTREAM_HOST%"
To provide different format for TCP and HTTP logging you can define two separate logging backends with the same address and different format. Then define two TrafficLog entity, one for TCP and one for HTTP with kuma.io/protocol: http selector.
Access Logs in JSON format
If you need an access log with entries in JSON format, you have to provide a template string that is a valid JSON object, e.g.
{
  "start_time":          "%START_TIME%",
  "source":              "%KUMA_SOURCE_SERVICE%",
  "destination":         "%KUMA_DESTINATION_SERVICE%",
  "source_address":      "%KUMA_SOURCE_ADDRESS_WITHOUT_PORT%",
  "destination_address": "%UPSTREAM_HOST%",
  "duration_millis":     "%DURATION%",
  "bytes_received":      "%BYTES_RECEIVED%",
  "bytes_sent":          "%BYTES_SENT%"
}
To use it with Logstash, use json_lines codec and make sure your JSON is formatted into one line.
Logging external services
When running Kuma on Kubernetes you can also log the traffic to external services. To do it, the matched TrafficPermission destination section has to have wildcard * value.
In such case %KUMA_DESTINATION_SERVICE% will have value external and %UPSTREAM_HOST% will have an IP of the service.
Matching
TrafficLog is an Outbound Connection Policy.
The only supported value for destinations.match is kuma.io/service.
